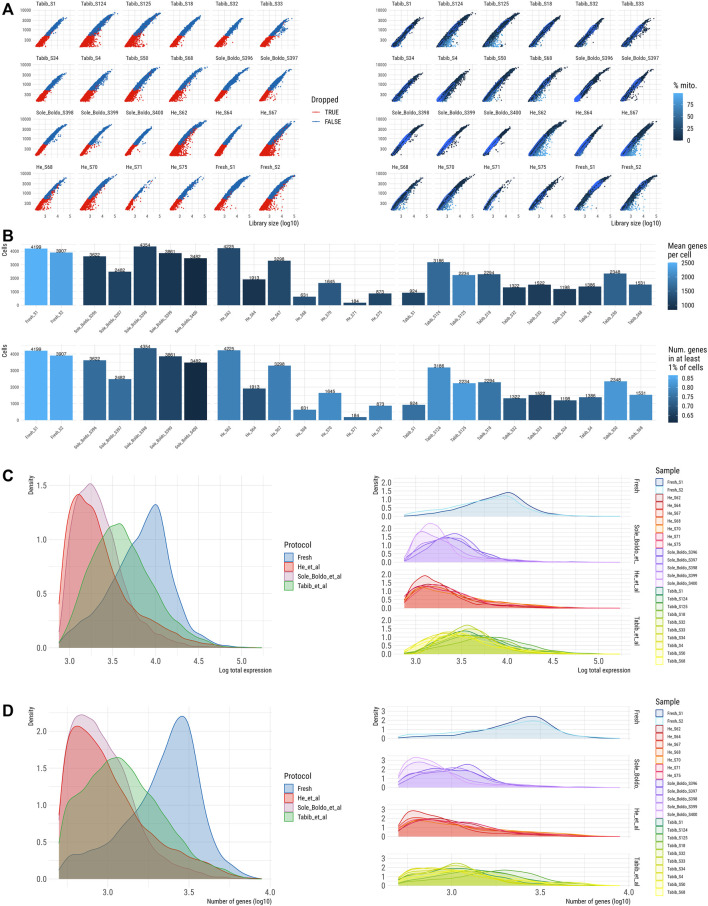
FIGURE 4.
QC of skin scRNA-seq dataset prior to normalisation and batch correction (A). Library size (x-axis) vs. number of genes per sample coloured by filter (left) and percentage of mitochondrial counts (right). (B) Number of cells per sample coloured by number of genes (top) and by number of genes in at least 1% of cells (bottom). Distribution of counts (C) per protocol (left) and per sample (right). Distribution of number of genes (D) per protocol (left) and per sample (right).

