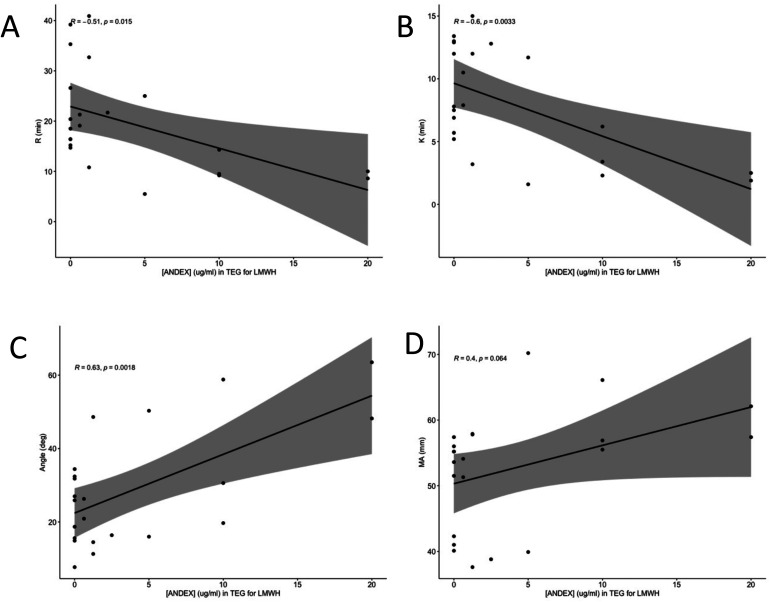
Figure 2.
Pearson Correlation of TEG parameters in LMWH at varying andexanet alfa concentrations. The x-axis is andexanet alfa concentration in ug/mL and the y-axis is the TEG parameter in its proper units. Figure 2A is for R time, 2B is for K time, 2C is for angle, and 2D is MA.

