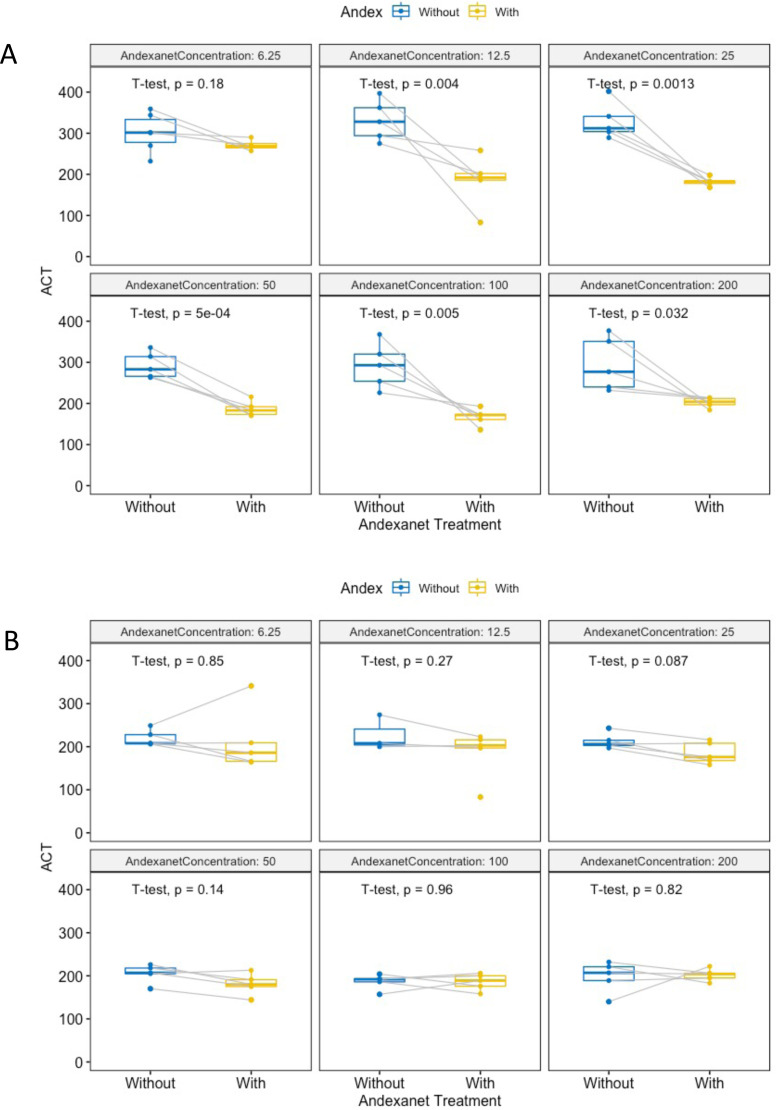
Figure 5.
Paired box and whisker plots of ACT before and after andexanet alfa treatment. The t-tests were run for the samples at each tested concentration. The andexanet alfa concentrations are in ug/mL, the ACT is in seconds. The lines connecting two dots indicated that the samples are paired. The color blue indicates that it is a sample before andexanet alfa treatment and the color yellow indicates that the sample is after andexanet alfa treatment. Figure 3a is for UFH and Figure 3b is for LMWH.

