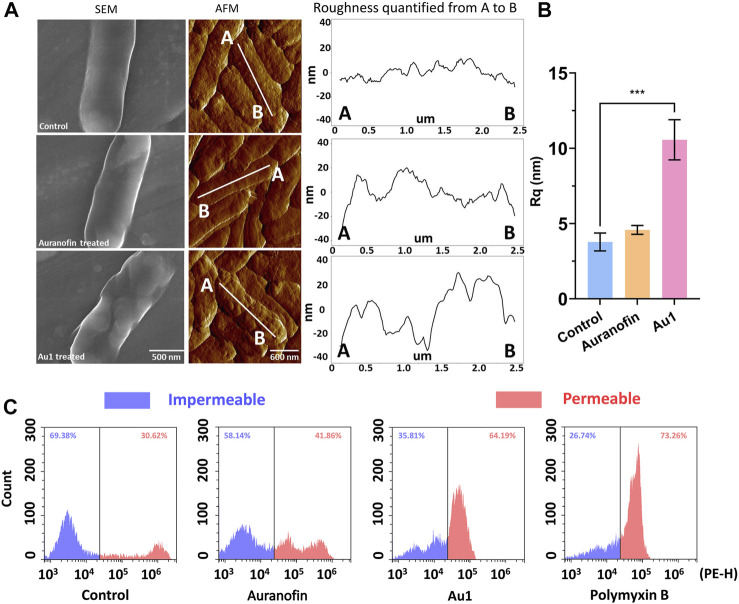
FIGURE 3.
(A) FE-SEM and AFM analysis of the morphology of P. aeruginosa after incubation with Au1 or auranofin. (B) Quantification of the root-mean-square roughness (Rq) of the bacterial surface. All experiments are performed in triplicated and data are presented as mean ± sd. *** means p < 0.001. (C) Flow cytometry analysis of the bacterial membrane permeability after incubation with auranofin, Au1 and polymyxin B. Blue colour represents the counted cell with impermeable membrane, and red colour represents the cell with permeable membrane.

