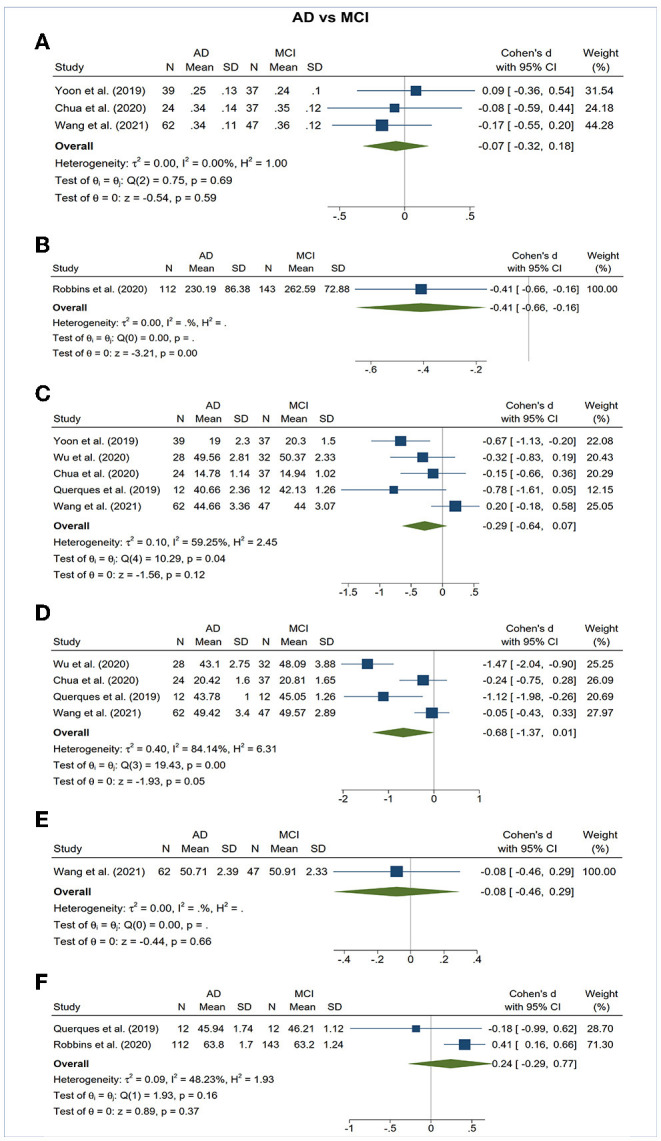
Figure 5.

Forest plot of OCTA measurements between subjects with Alzheimer's Disease (AD) and mild cognitive impairment (MCI). The meta-analyses were conducted with a random-effects model. Horizontal bar indicates 95% confidence intervals (CI), and the size of the squares denotes the weight attributed to each article. The diamonds represent the standardized mean differences with the width showing the 95% CI. (A) Foveal avascular zone area. (B) Choroidal thickness. (C) Superficial capillary plexus vessel density. (D) Deep capillary plexus vessel density. (E) Peripapillary vessel density. (F) Choroidal perfusion density.
