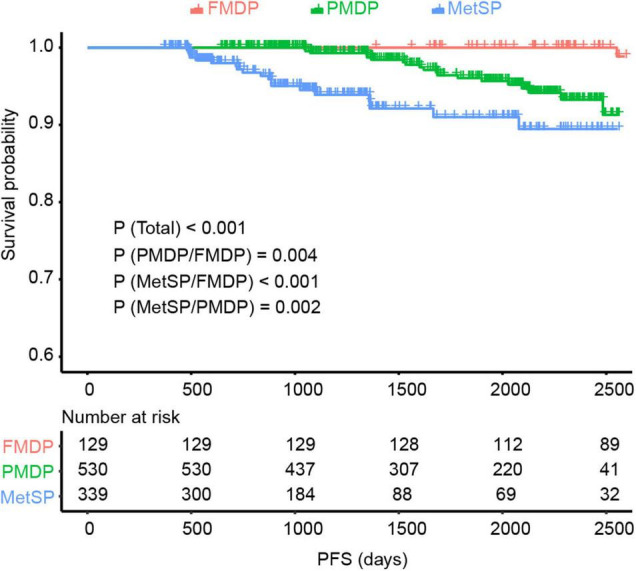
FIGURE 1.

The Kaplan–Meier survival analysis showed significant differences between the three groups [p < 0.001 (Total)] and pairwise comparisons {p = 0.004 [partial metabolic disorder patients (PMDP)/free metabolic disorder in patients (FMDPs)], p < 0.001 [metabolic syndrome in patients (MetSP)/FMDP], p = 0.002 [metabolic syndrome in patients (MetSPs)/PMDP]} also showed noteworthy differences in EC. The MetSP group had the best progression-free survival (PFS), followed by PMDP group and then the FMDP group.
