Figure 1.
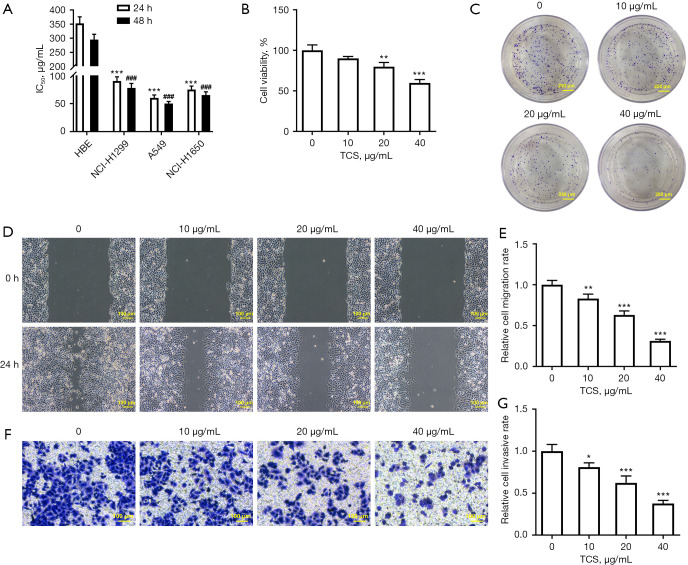
TCS inhibits the proliferation, invasion, and migration of A549 cells. (A) CCK-8 is performed to determine the effect of TCS on the activity of HBE cells and three types of NSCLC cells (NCI-H1299, NCI-H1650, and A549) at 24 and 48 h, respectively. ***P<0.001 vs. 24 h; ###P<0.001 vs. 48 h. (B) CCK-8 detects the effect of different concentrations of TCS (0, 10, 20, and 40 µg/mL) on the activity of A549 cells. **P<0.01 and ***P<0.001 vs. 0 µg/mL. (C) Colony formation assay detects the effect of different concentrations of TCS (0, 10, 20, and 40 µg/mL) on the proliferation of A549 cells, which was stained with 0.05% crystal violet. (D,E) Wound healing assay detects the effect of different concentrations of TCS (0, 10, 20, and 40 µg/mL) on the migration of A549 cells, which was observed by a light microscope. **P<0.01 and ***P<0.001 vs. 0 µg/mL. (F,G) Transwell assay detects the effect of different concentrations of TCS (0, 10, 20, and 40 µg/mL) on the invasion of A549 cells, which was stained with 0.1% crystal violet. *P<0.05 and ***P<0.001 vs. 0 µg/mL. IC50, half maximal inhibitory concentration; HBE, human bronchial epithelial; TCS, trichosanthin; CCK-8, Cell Counting Kit-8; NSCLC, non-small cell lung cancer.

