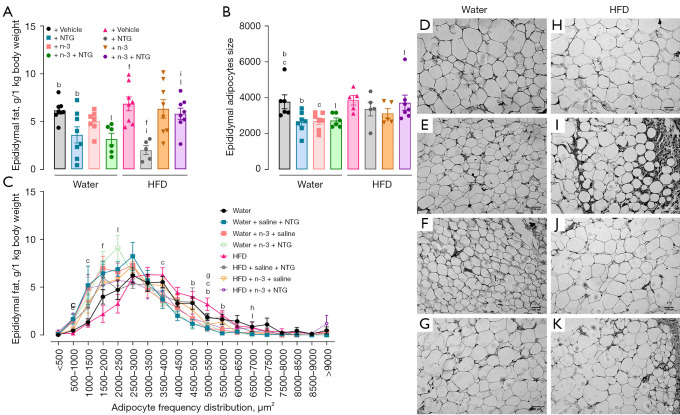
Figure 4.
Profile of epididymal white adipose tissue in the different experimental groups. (A) Epididymal white adipose tissue weight; (B,C) histological analysis of epididymal adipocyte sizes and frequency of epididymal adipocyte sizes after migraine and HFD induction protocols. The evaluations were performed by an examiner blinded to the experimental groups. After the analysis, one representative picture per group was selected to compose the panel of representative images. (D-K) Images were captured using a Zeiss AxioImager M2 light microscope under×200 magnification (Carl Zeiss, Gottingen, Germany). Representative histological images of epididymal adipose tissue in: water control group (water + saline; D), NTG-injected rats (water + NTG; E), rats with n-3 supplementation (water + n-3; F), NTG-injected rats with n-3 supplementation (water + n-3 + NTG; G), HFD control group (HFD + saline; H), HFD NTG-injected rats (HFD + NTG; I), HFD rats with n-3 supplementation (HFD + n-3; J), and HFD NTG-injected rats with n-3 supplementation (HFD + n-3 + NTG; K), respectively. Data are presented as mean ± SEM of 4 to 8 rats per group (mixed-effect analysis followed by uncorrected Fisher’s LSD’s post hoc test; or one-way ANOVA followed by uncorrected Fisher’s LSD’s post hoc test). b, P<0.05 water + saline vs. water + NTG; c, P<0.05 water + saline vs. water + n-3; f, P<0.05 HFD + saline vs. HFD + NTG; g, P<0.05 HFD + saline vs. HFD + n-3; h, P<0.05 HFD + n-3 vs. HFD + n-3 + NTG; i, P<0.05 HFD + NTG vs. HFD + n-3+ NTG; l, P<0.05 water + n-3 + NTG vs. HFD + n-3+ NTG. NTG, nitroglycerin; HFD, high fructose diet; SEM, standard error of the mean.

