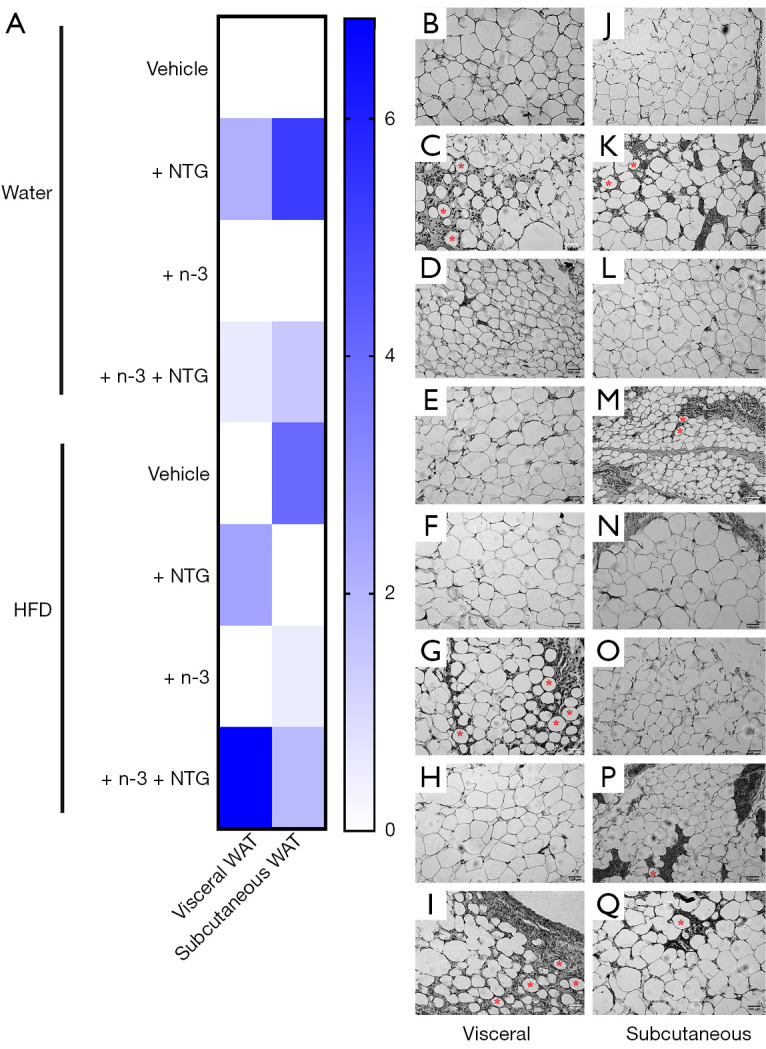
Figure 5.

Heat mapping showing the semi-quantitative analysis of CLS in inguinal (subcutaneous WAT) and epididymal (visceral WAT) adipose tissue. (A) Colors vary in shades of blue, with an intensity proportional to the number of CLS in the respective adipose tissue. The evaluations were performed by an examiner blinded to the experimental groups. After the analysis, one representative picture per group was selected to compose the panel of representative images. Images were captured using a Zeiss AxioImager M2 light microscope under ×200 magnification (Carl Zeiss, Gottingen, Germany). Representative histological images of inguinal adipose tissue in: water control group (water + saline; B), NTG-injected rats (water + NTG; C), rats with n-3 supplementation (water + n-3; D), NTG-injected rats with n-3 supplementation (water + n-3 + NTG; E), HFD control group (HFD + saline; F), HFD NTG-injected rats (HFD + NTG; G), HFD rats with n-3 supplementation (HFD + n-3; H), and HFD NTG-injected rats with n-3 supplementation (HFD + n-3 + NTG; I), respectively; and epididymal adipose tissue in: water control group (water + saline; J), NTG-injected rats (water + NTG; K), rats with n-3 supplementation (water + n-3; L), NTG-injected rats with n-3 supplementation (water + n-3 + NTG; M), HFD control group (HFD + saline; N), HFD NTG-injected rats (HFD + NTG; O), HFD rats with n-3 supplementation (HFD + n-3; P), and HFD NTG-injected rats with n-3 supplementation (HFD + n-3 + NTG; Q), respectively. The red asterisks indicate the adipocytes presenting CLS. CLS, crown-like structure. WAT, white adipose tissues; NTG, nitroglycerin; HFD, high fructose diet.
