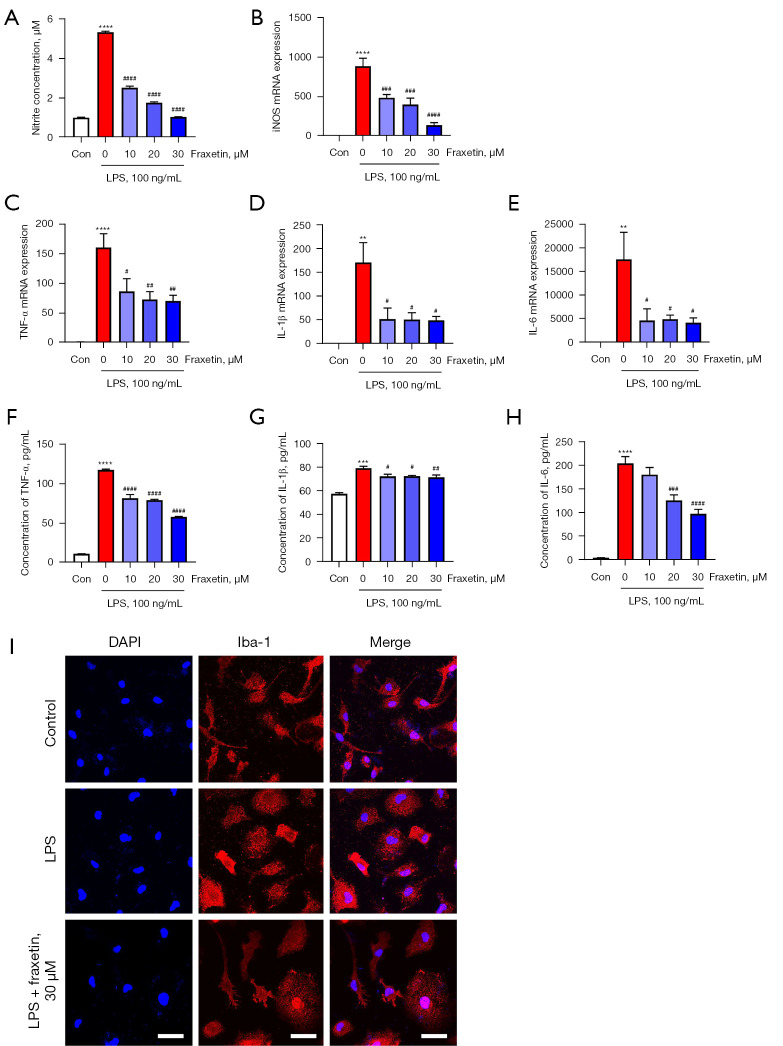
Figure 2.
Fraxetin reduces proinflammatory cytokine production and attenuates activation of LPS-stimulated microglia. (A) The concentration of NO in the supernatant was examined using a Griess assay. n=4–5 per group. (B) iNOS mRNA was quantified using RT-PCR. n=4–5 per group (C-E). TNF-α (C), IL-1β (D), and IL-6 (E) mRNA levels were quantified by RT-PCR. n=3–4 per group (F-H). The protein concentrations of TNF-α (F), IL-1β (G), and IL-6 (H) were measured using an ELISA kit. n=4–7 per group. The values represent the mean ± SEM. **P<0.01, ***P<0.001 and ****P<0.0001 compared with the control group. #P<0.05, ##P<0.01, ###P<0.001, ####P<0.0001 compared with groups only stimulated with LPS. (I) Microglia were treated with 30 µM fraxetin and then stained with DAPI and Iba-1. Scale bars: 30 µm. LPS, lipopolysaccharide; NO, nitric oxide; iNOS, inducible nitric oxide synthase; RT-PCR, real-time polymerase chain reaction; TNF, tumor necrosis factor; IL-1β, interleukin-1 beta; IL-6, interleukin-6; ELISA, enzyme-linked immunosorbent assay; DAPI, 4',6-diamidino-2-phenylindole.

