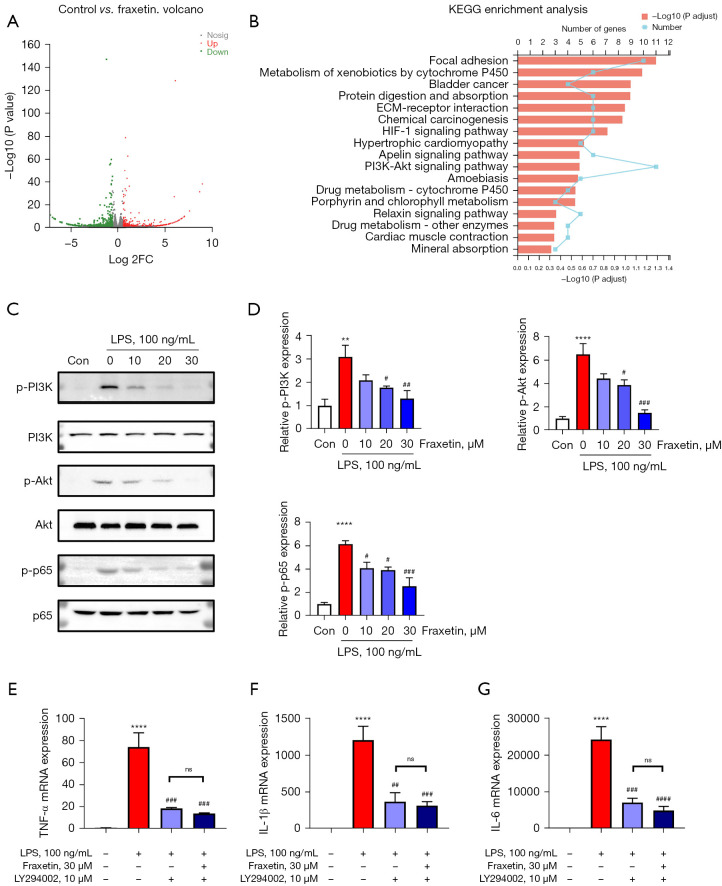
Figure 3.
Fraxetin regulates the PI3K/Akt/NF-κB signaling pathway in LPS-activated microglia. (A) Volcano plot for LPS-activated primary microglia between the control and fraxetin-treated groups. DEGs are listed. n=3 per group. (B) Differentially downregulated genes were processed for functional enrichment analysis of the KEGG pathway. (C) Western blotting was used to detect the protein levels of p-PI3K, p-Akt, and p-p65, n=3 per group. (D) Western blot quantification. The values represent mean ± SEM. (E-G) TNF-α (E), IL-1β (F), and IL-6 (G) mRNAs were quantified by RT-PCR. n=4 per group. **P<0.01 and ****P<0.0001 vs. control group. #P<0.05, ##P<0.01, ###P<0.001, ####P<0.0001 vs. groups only treated with LPS. NS means no significant difference. LPS, lipopolysaccharide; DEG, differentially expressed gene; KEGG, Kyoto Encyclopedia of Genes and Genomes; SEM, standard error of the mean.

