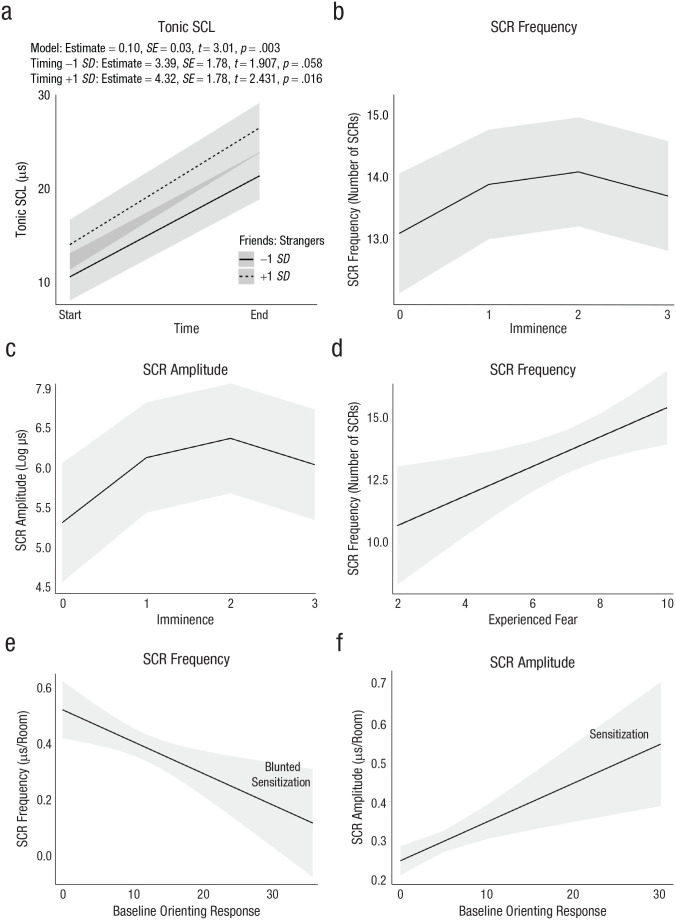
Fig. 1.
Model estimates of effects of context and endogenous variables on electrodermal-activity measures. The top row shows (a) mean tonic skin conductance level (SCL) as a function of measurement time and friends:strangers ratio and (b) mean skin conductance response (SCR) frequency as a function of threat imminence. The middle row shows (c) mean SCR amplitude as a function of threat imminence and (d) mean SCR frequency as a function of experienced fear. The bottom row shows (e) mean SCR frequency as a function of baseline orienting response and (f) mean SCR amplitude as a function of baseline orienting response. Values in (e) and (f) index sensitization outcomes. Lines depict predicted values (marginal effects) for the regression model; error bands indicate 95% confidence intervals.

