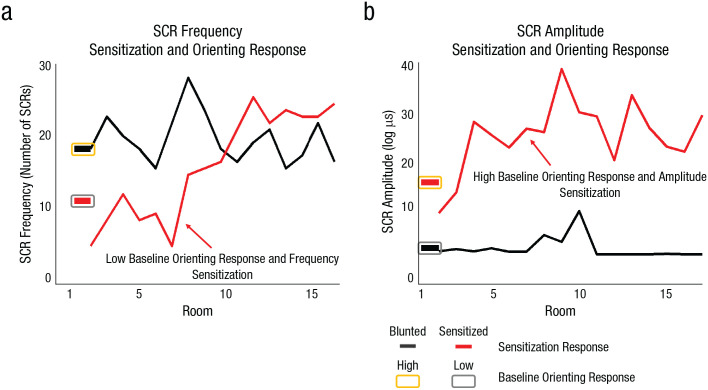
Fig. 3.
Skin conductance response (SCR) frequency (a) and amplitude (b) as a function of room number, sensitization, and baseline orienting response. Results are shown separately for two example participants, one showing a blunted sensitization response (black) and the other showing a sensitized response (red).

