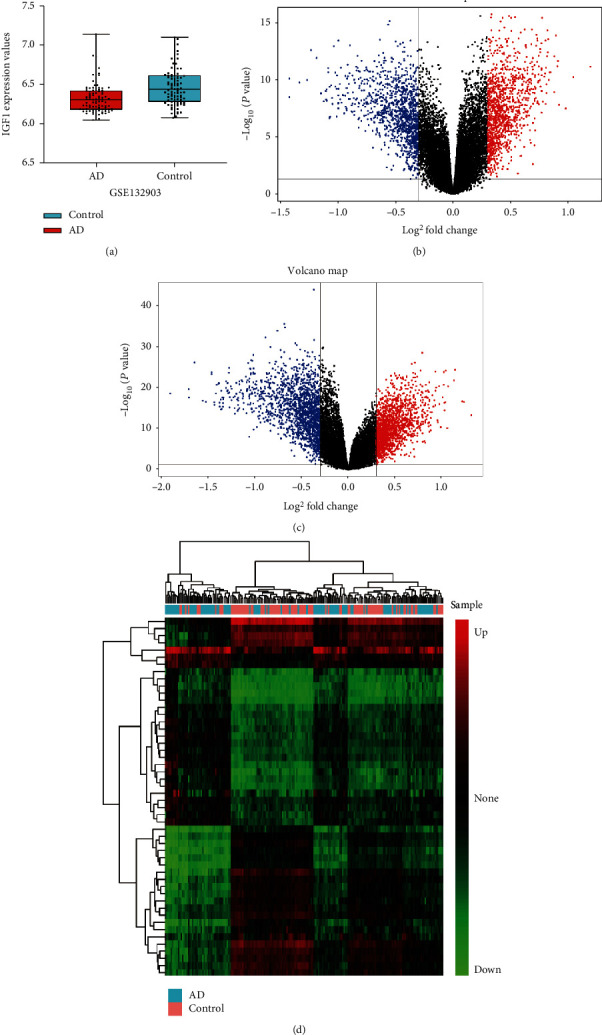
Figure 2.

Differential expression analysis. (a) IGF1 expression between AD and non-dementia controls in GSE132903. Volcano plots of DEGs in AD/control (b) and IGF1-low/high (c) groups: blue and red represent down-regulated and up-regulated, respectively. (d) Clustering heatmap of the top 50 down- and up-regulated DEGs between AD and non-dementia controls: the gradual change of color from green to red indicates that the gene expression changes from down-regulation to up-regulation. AD: Alzheimer's disease; DEGs: differentially expressed genes.
