
Figure 3.
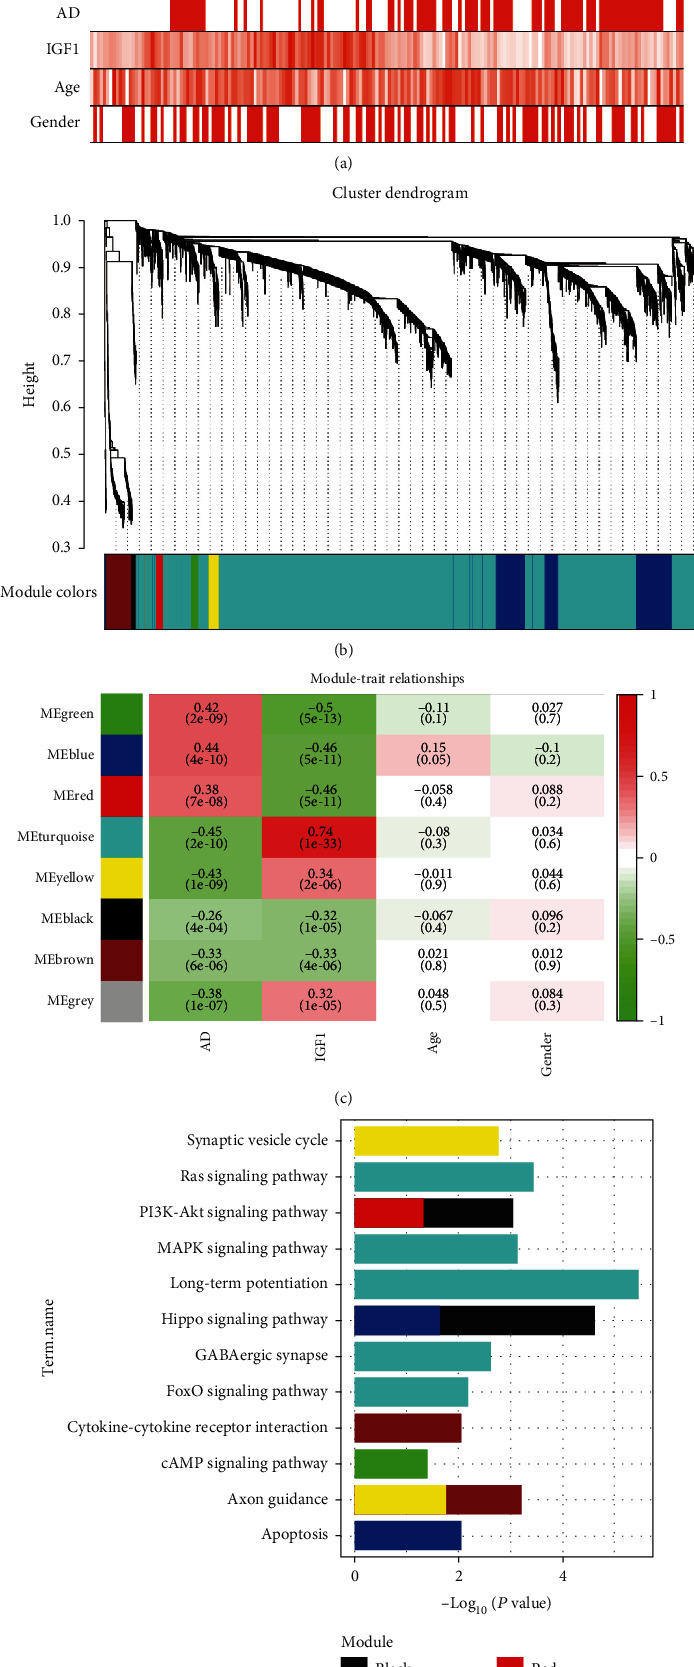
Weighted gene correlation network analysis. (a) Sample dendrogram and trait heatmap. (b) Cluster dendrogram of all DEGs with assigned module colors: non-clustering genes are displayed in gray. (c) Module-trait associations: the gradual change of color from green to red represents the changing correlation between ME and trait from negative to positive. (d) KEGG pathways enriched by module genes. AD: Alzheimer's disease; KEGG: Kyoto Encyclopedia of Genes and Genomes; ME: module eigengene.