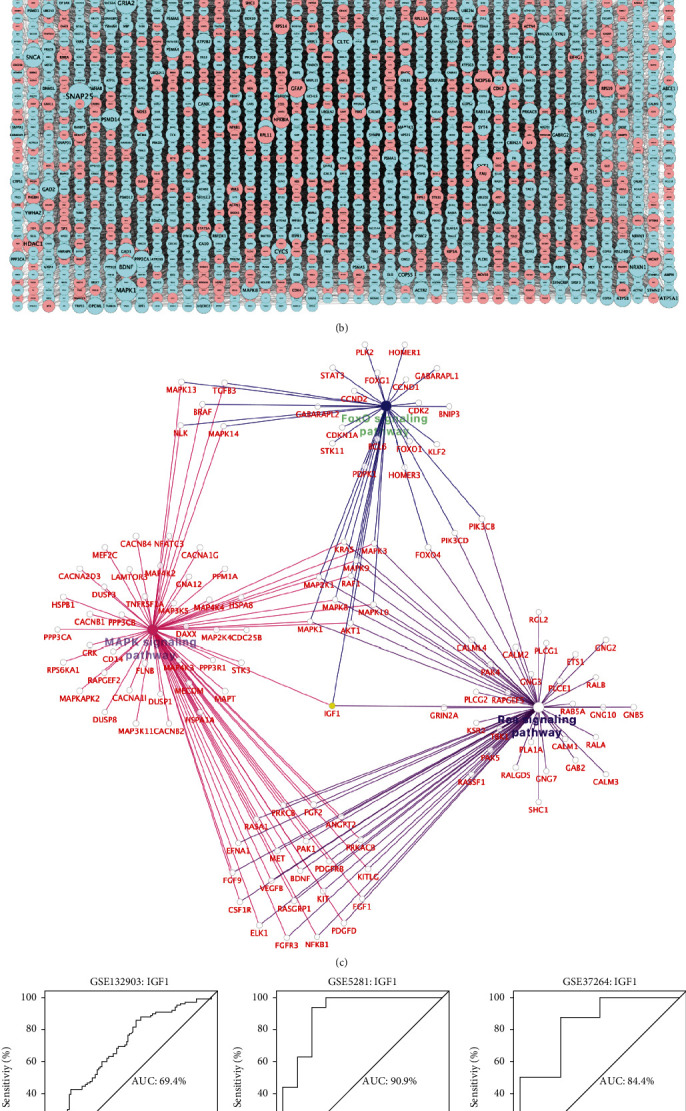
Figure 4.

PPI network and AUC analysis. (a) Scatterplots of the relationship between MM (x-axis) and GS (y-axis). (b) PPI network based on turquoise module genes: node size reflects the degree of gene connectivity; down-regulated IGF1 is marked in yellow; blue and red represent down-regulated and up-regulated, respectively. (c) Cross-talking pathways of IGF1: down-regulated IGF1 is marked in yellow. (d) The predictive performance of IGF1 in AD measured by AUC analysis. (e) IGF1 expression between AD and non-dementia controls in training sets. AD: Alzheimer's disease: AUC: area under the curve; GS: gene significance; MM: module membership; PPI: protein-protein interaction.
