Figure 1.

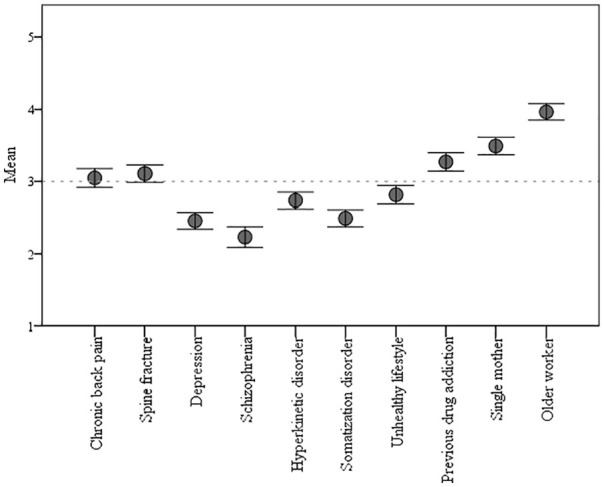
Mean and 95% confidence interval for workplace inclusion of each case story on a scale from 1 (very poorly) to 5 (very well): ‘Given the current circumstances, how do you think person N.N. fits into your work group?’.

Mean and 95% confidence interval for workplace inclusion of each case story on a scale from 1 (very poorly) to 5 (very well): ‘Given the current circumstances, how do you think person N.N. fits into your work group?’.