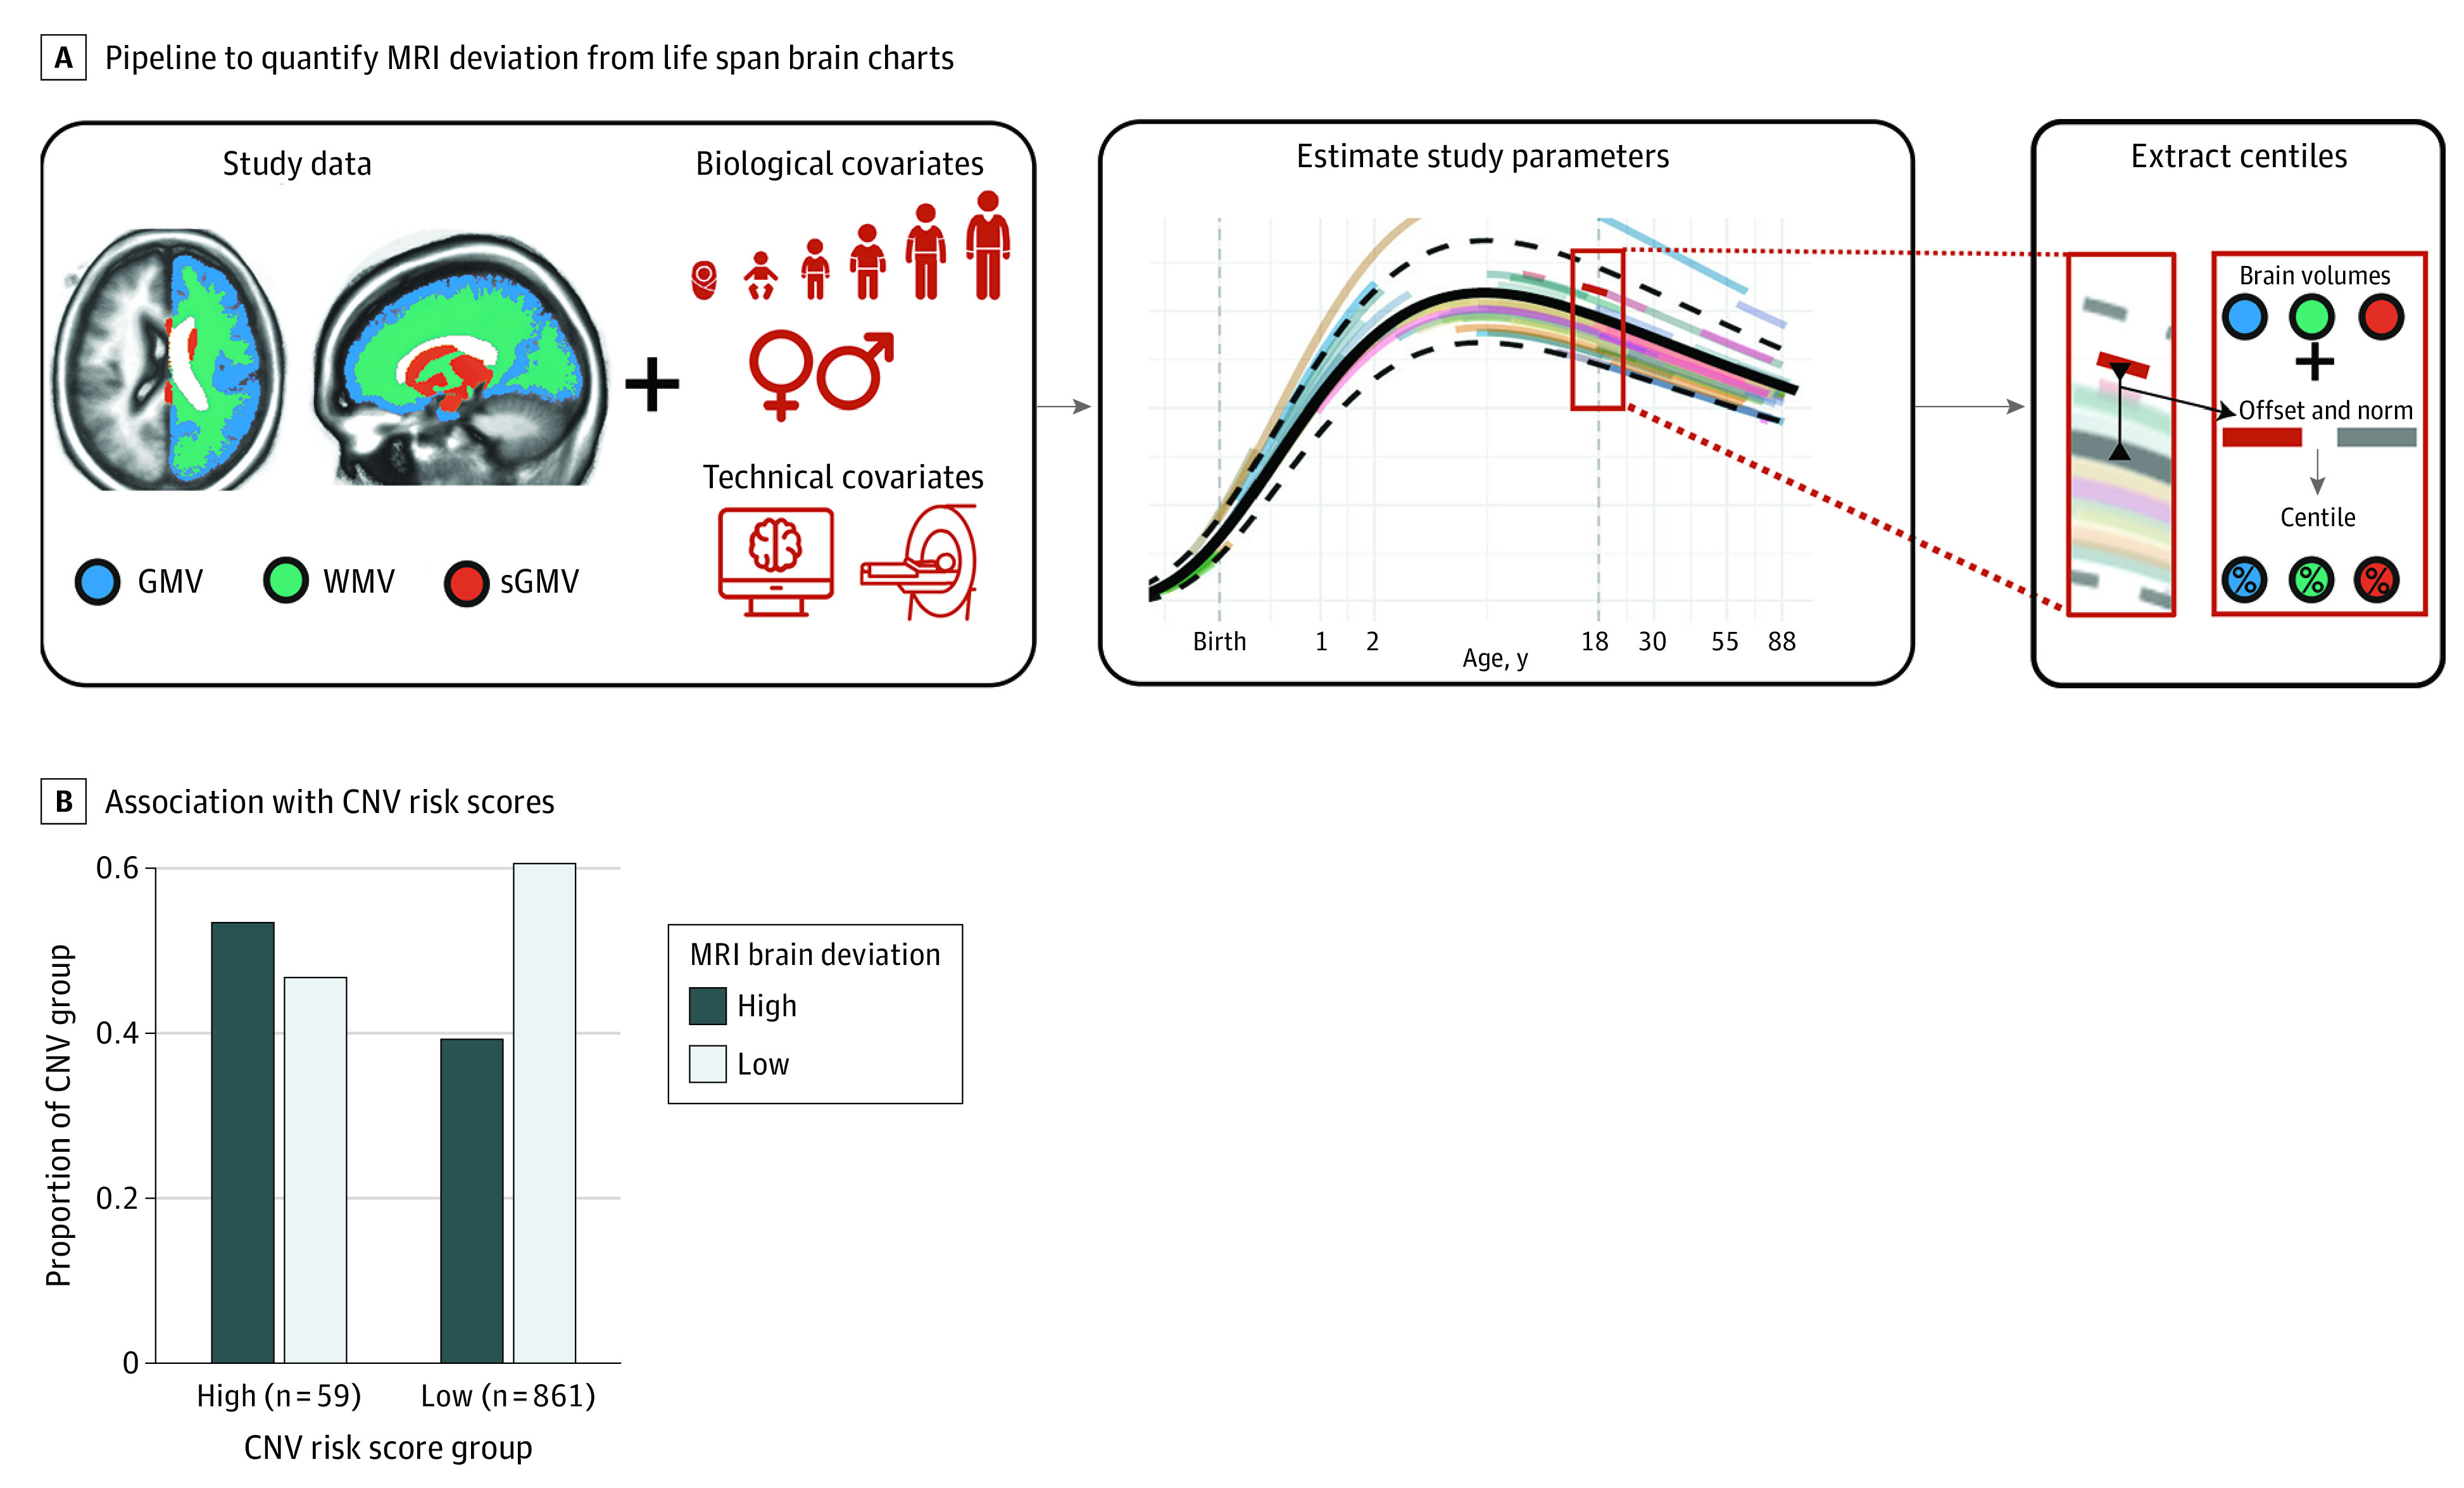
Figure 3. Deviations From Neuroimaging Normative Models Associated With the Presence of Copy Number Variants (CNVs) With High Risk Scores.

A, A schematic overview of the pipeline used for estimation of centile scores for Philadelphia Neurodevelopmental Cohort magnetic resonance imaging (MRI) data relative to a normative model. MRI data were harmonized by estimating study offset relative to other studies included in the reference sample, and centile scores were calculated for each individual based on age-specific and sex-specific expectations. Individuals are categorized as high deviation if they are in the first or tenth decile in at least 1 imaging phenotype: cortical gray matter volume (GMV), subcortical gray matter volume (sGMV), or cerebral white matter volume (WMV). B, Visualization of the comparison between the proportion of individuals with high CNV risk scores (cumulative probability of haploinsufficiency greater than 1 or cumulative probability of triplosensitivity greater than 1) categorized as high brain deviation (first or tenth decile in at least 1 imaging phenotype); individuals with high CNV risk scores categorized as low brain deviation (second to ninth decile in all imaging phenotypes); individuals with low CNV risk scores and low brain deviation; and individuals with low CNV risk scores and high brain deviation. This analysis was conducted in the subset of 920 individuals with CNV data and structural brain magnetic resonance imaging data that met quality-control criteria. eFigure 10 in the Supplement shows the full distribution of individual brain imaging–based centile scores.
