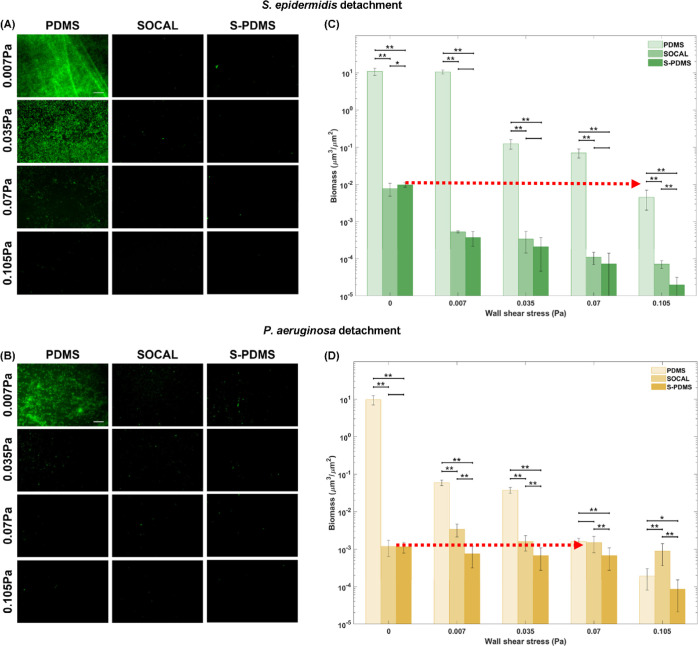
Figure 7.
Representative fluorescent images and biomass change with wall shear stress for 7 day biofilms grown in static culture: (A,C) S. epidermidis FH8 and (B,D) P. aeruginosa PAO1 on PDMS, S-PDMS, and SOCAL after flow shear at 0.007, 0.035, 0.07, and 0.105 Pa. At least six images were analyzed for each surface at each wall shear stress based on three replicates. *p < 0.05 and **p < 0.001.

