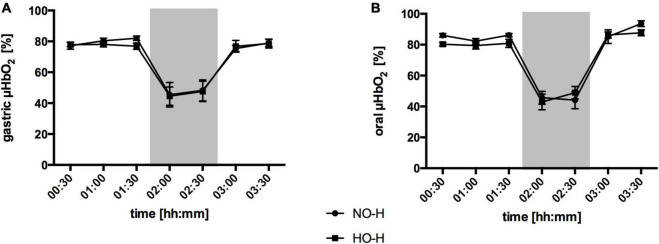
FIGURE 4.
Effect of local oxygen application on microvascular oxygenation: Microvascular oxygenation (μHbO2) in percentage (%) at the gastric (A) and oral (B) mucosa. The animals received a continuous gas application with either N2 to maintain local normoxia (NO-H) or O2 for local hyperoxia (HO-H) followed by hemorrhage and retransfusion. One hour of acute hemorrhage is marked grey. Data are presented as mean SEM for n = 6 dogs.

