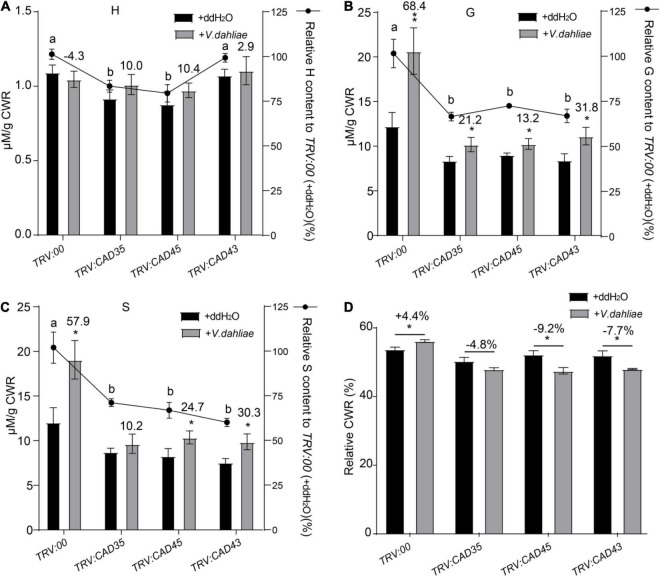
FIGURE 6.
Quantitative analyses of H-, G-, and S-units of lignin in the stem tissues from TRV:00, TRV:CAD35, TRV:CAD45, and TRV:CAD43 VIGS plants under the control (ddH2O) and V. dahliae treatment conditions. (A–C) Quantitative analyses of H-, G-, and S-units of lignin in TRV:00, TRV:CAD35, TRV:CAD45, and TRV:CAD43 VIGS plants, respectively. The y axel on the left indicates the contents of individual unit; the y axel on the right indicates the relative content of individual unit, TRV:CAD35, TRV:CAD45, and TRV:CAD43 to that of TRV:00. The number on top of the gray bars indicates the increase percentage of each unit under V. dahliae infection relative to the control (ddH2O); *P < 0.05, **P < 0.01 (Student’s t-test). The different letters above the black bars indicate significant differences; P < 0.05 (Student’s t-test). (D) The relative cell wall residue (CWR) in TRV:00, TRV:CAD35, TRV:CAD45, and TRV:CAD43 VIGS plants under the control (ddH2O) and V. dahliae treatment conditions. The number on top of the Ebars indicates the increase percentage of each unit under V. dahliae infection relative to the control (ddH2O); *P < 0.05 (Student’s t-test); the data represent the mean ± SD (n = 3 biological replicates). Two-weeks-old VIGS-plants were inoculated with V. dahliae at an inoculum of 1 × 10⁷ spores/mL using the root-dipping method. The samples were collected 48 h after the inoculation.

