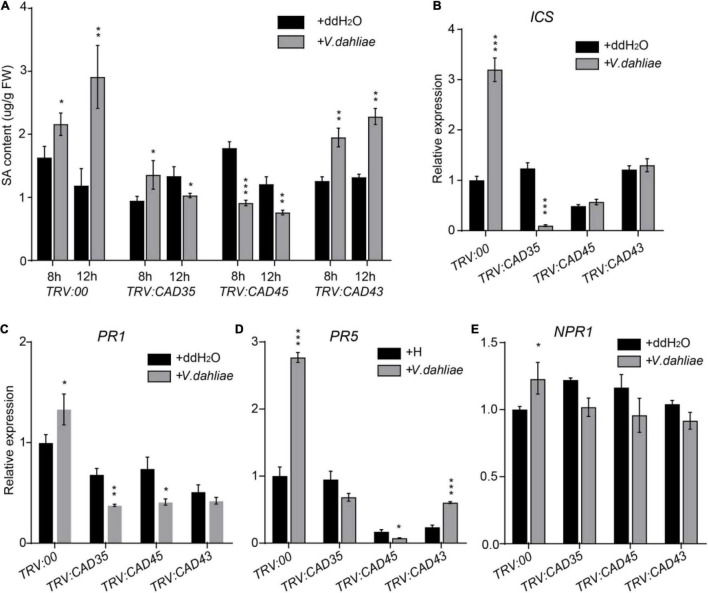
FIGURE 8.
Silencing of GhCAD35, GhCAD45, and GhCAD43 impaired V. dahliae induced SA responses. (A) Quantification of SA contents in TRV:00, TRV:CAD35, TRV:CAD45, and TRV:CAD43 VIGS plants 8- and 12-h post-infection by V. dahliae. (B–E) The expression level of SA biosynthesis gene ICS and SA responsive genes PR1, PR5, and NPR1 in TRV:00, TRV:CAD35, TRV:CAD45, and TRV:CAD43 VIGS plants 12-h post-infection by V. dahliae. The data represent the mean ± SD (n = 3 biological replicates), *P < 0.05, **P < 0.01, ***P < 0.001 (Student’s t-test).

