FIGURE 2.

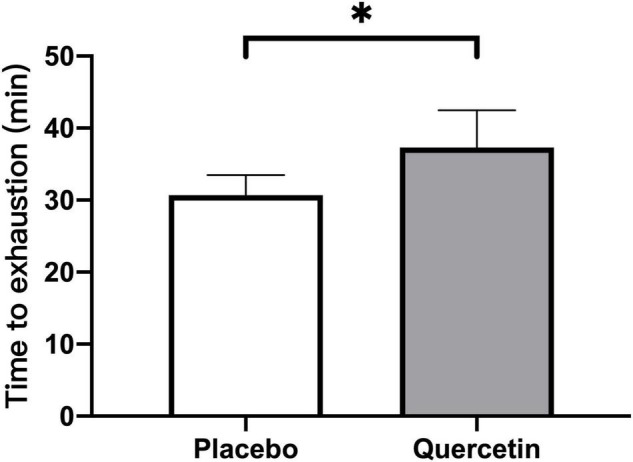
Mean values data of all participants for the time-to-exhaustion tests of the second cycling exercise with 75% VO2max. *Significant difference between quercetin and placebo (p < 0.05). Values are expressed as mean ± SE, N = 12.

Mean values data of all participants for the time-to-exhaustion tests of the second cycling exercise with 75% VO2max. *Significant difference between quercetin and placebo (p < 0.05). Values are expressed as mean ± SE, N = 12.