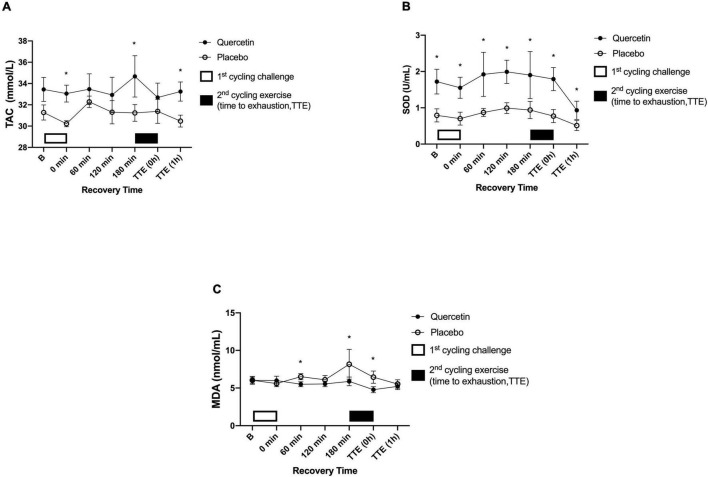
FIGURE 5.
Serum total antioxidant capacity (TAC) (A), superoxidase dismutase (SOD) (B), and malondialdehyde (MDA) (C) concentrations in (-◦-) placebo and (-•-) quercetin trials. B represents before the first cycling challenge. TTE (0h,1h): represents immediately, and 1-h after the second cycling exercise, respectively. *Significant difference between quercetin and placebo (p < 0.05). Values are expressed as mean ± SE, N = 12.

