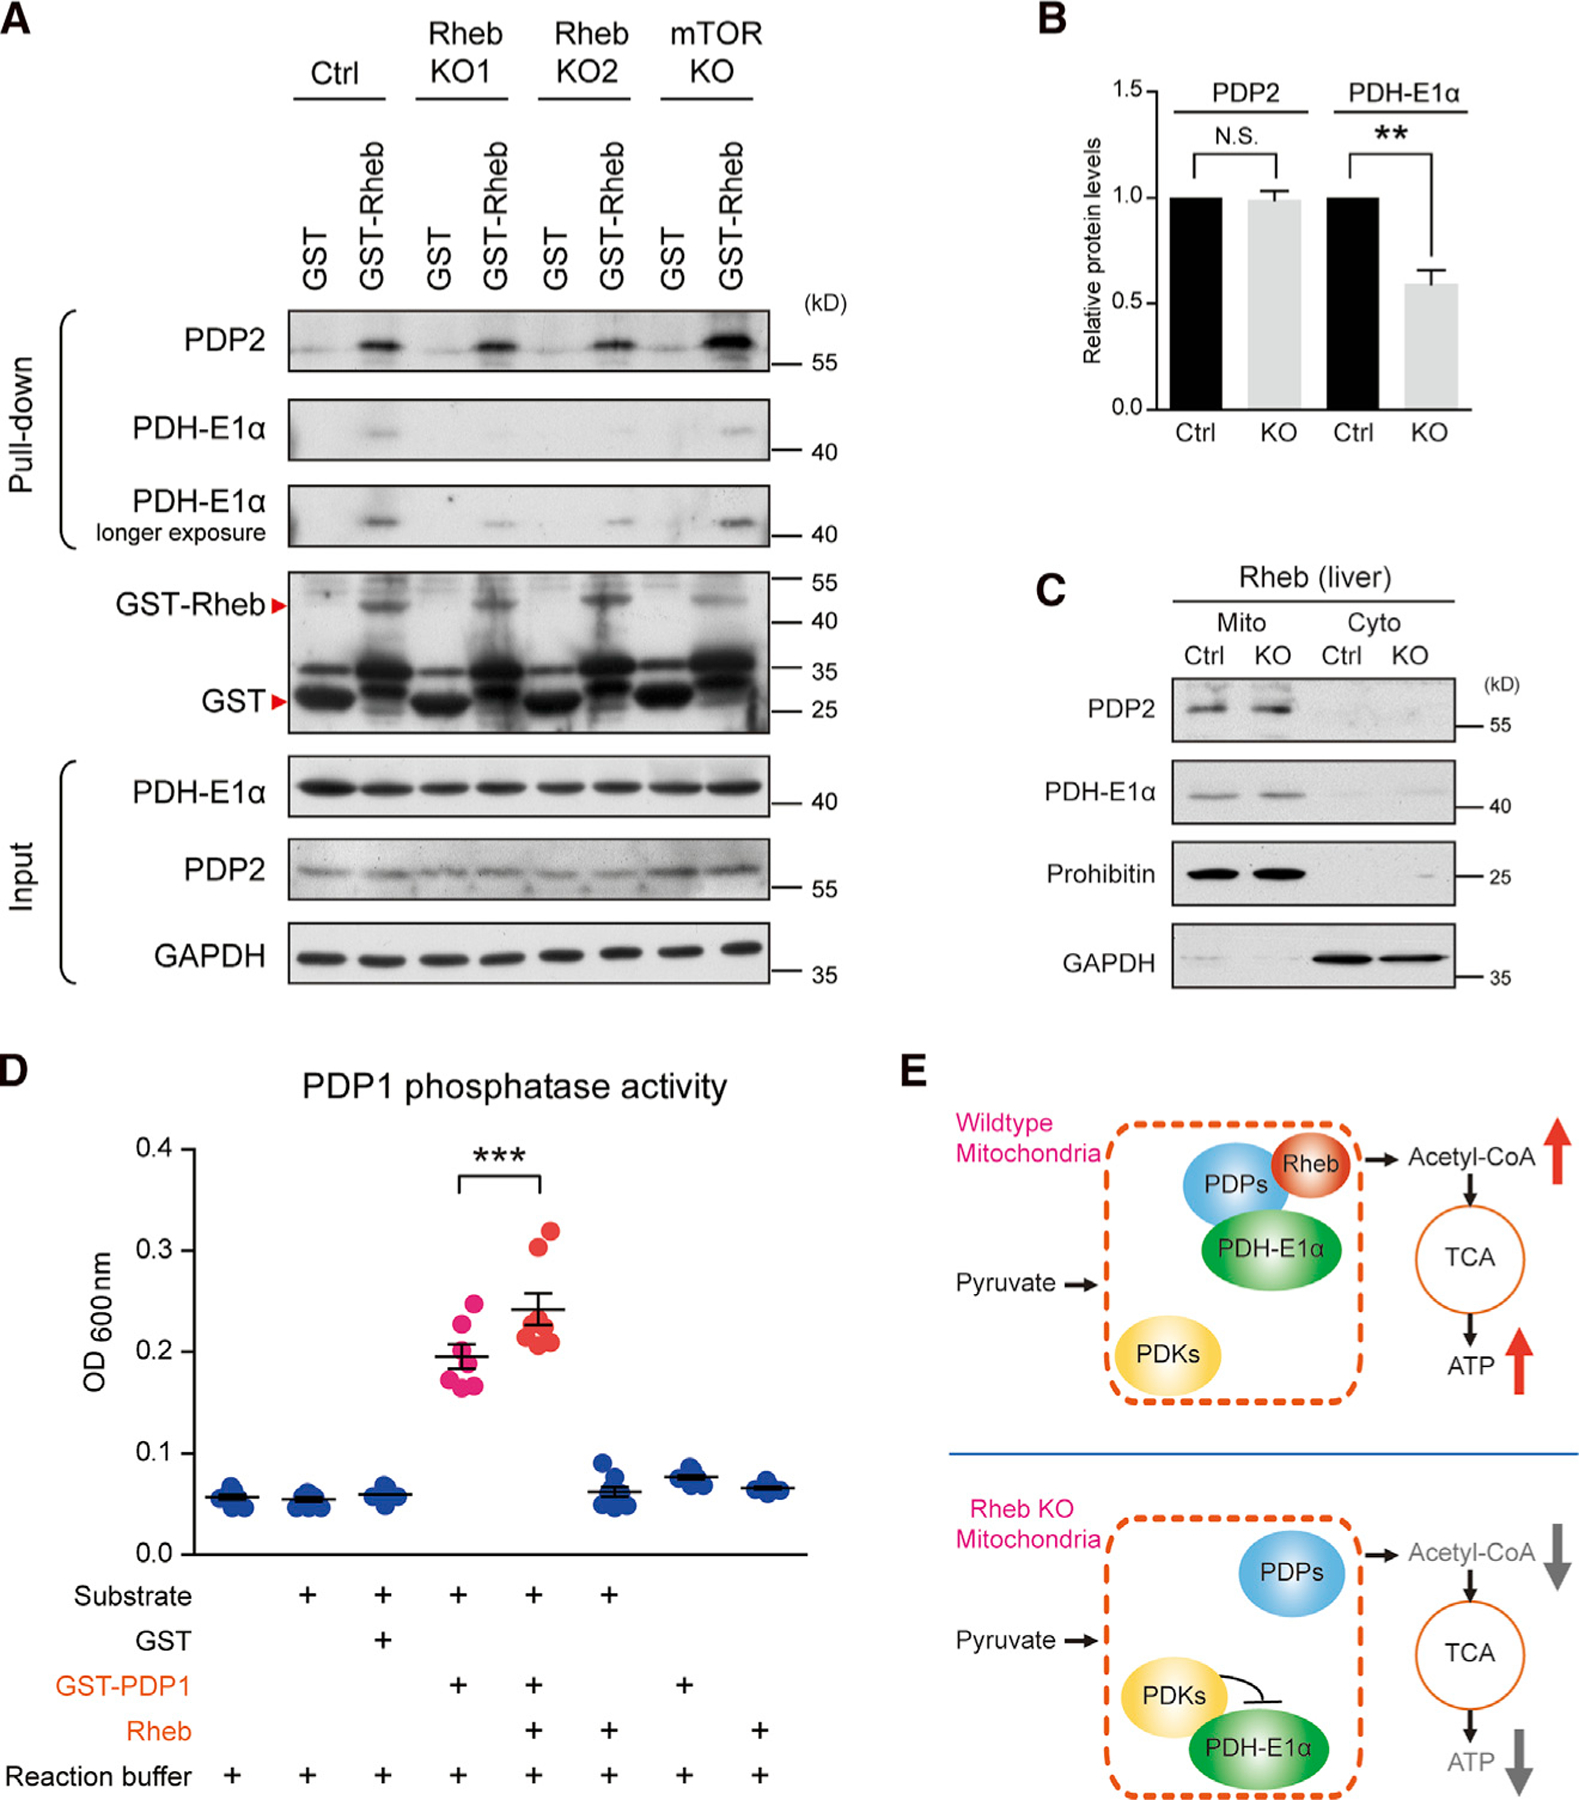
Figure 5. Rheb binding to PDPs enhances its activity to PDH.

(A and B) GST pull-down (A) and quantification (B) comparing GST-Rheb pull-down of PDP2 and PDH-E1α from liver of Rheb KO versus mTor KO mice. Despite equivalent amounts of PDP2, less PDH-E1α is pulled down from Rheb KO. N = 3 independent experiments, PDP2, p = 0.8183; PDH-E1α, p = 0.0034.
(C) Subcellular fractionation showing comparable amounts of PDP2 and PDH-E1α in liver mitochondria of Ctrl and Rheb KO mice. Prohibition, the mitochondria marker; cyto, cytosol; and Mito, mitochondria.
(D) Incubation of Rheb protein with PDP1 increases the phosphatase activity of PDP1. N = 8 independent experiments.
(E) Diagram illustrating that Rheb activates PDH consequent to binding PDH phosphatases (PDP) and enhancing the association of PDH with PDP. All data represent mean ± SEM. Statistical analysis was performed by using two-tailed Student’s t test (B) or one-way ANOVA with Tukey post hoc test (D), and *p < 0.05, **p < 0.01, and ***p < 0.001. See also Figure S4.
