Figure 6.

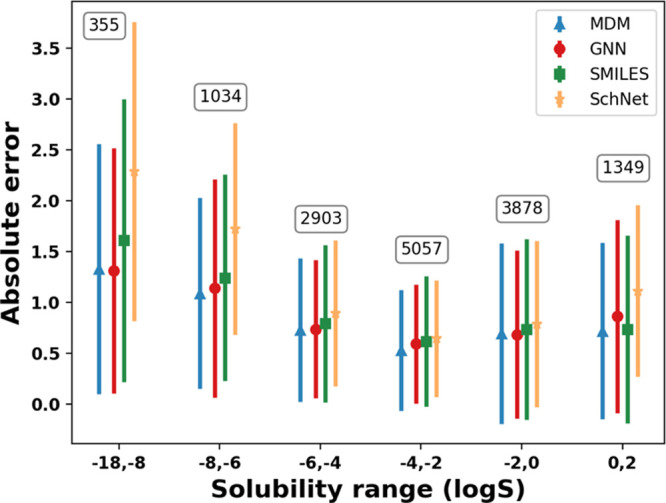
Test set error by solubility range (in log S) for the four models with the number of test molecules in each bin annotated on the plot, showing the mean and standard deviation per bin.

Test set error by solubility range (in log S) for the four models with the number of test molecules in each bin annotated on the plot, showing the mean and standard deviation per bin.