

Abstract

With energy savings and emission reduction becoming national policies in recent years, the environmental impacts of industrial production are more and more critical. Most of the studies have concentrated on the environmental effects of the industrial production process. Little attention has been paid to the energy consumption and pollution emission in extracting, processing, and transporting the feedstock and other secondary materials. An integrated multiobjective optimization framework is proposed for the steam cracking process on the basis of a life cycle assessment and data-driven modeling methods. A multiobjective economic–environmental optimization model is developed on the basis of industrial and simulated data. A multiobjective optimization model combined with energy cost is also developed for comparative study. The nondominated sorting genetic algorithm-II is utilized to solve the problems, and the Pareto front is obtained. An industrial case study is carried out to indicate the effectiveness of the proposed method. The results show that the LCA-based method can better represent the environmental impacts in comparison with the standard energy cost model. Therefore, the proposed method can achieve a better tradeoff between economic benefits and environmental impacts for guiding ethylene production.
1. Introduction
Olefins and aromatics are the basic raw materials for most products in the petrochemical industry. As the primary olefin producer, the cracking furnace is always the key concern of the ethylene industry. Many researchers have studied the operation optimization of a cracking furnace to get higher yields and higher profits.1 However, recent trends in environmental protection have led to a proliferation of studies that decrease the energy consumption and the pollutant emission of an ethylene plant. The managers of the ethylene plants also pay more attention to these issues because of the national energy-savings and emission-reduction policies.
As the heart of an ethylene plant, the cracking furnaces have been studied widely for several decades.2 Previous studies have indicated that the coil outlet temperature (COT) and gas temperature profile are closely related to the ethylene yields and the rate of coke deposition.3 Early examples of research into the optimization of the cracking furnace have focused on boosting the profits and enhancing the yields of key products such as ethylene and propylene. Lim et al. formulated the decoking scheduling problem of the cracking furnaces as an MINLP, and three alternative solution strategies were compared for higher yields and lower loads of computation.4 A model of thermal cracking of propane was developed by Berreni et al. The effect of the process gas temperature profile was studied in detail to maximize the profits.5 Nian et al. proposed a hybrid algorithm on the basis of a differential evolution algorithm and a group search optimization algorithm to maximize ethylene and propylene yields by optimizing the coil outlet temperature (COT) and steam to hydrocarbon ratio (SHR).6 Xia et al. studied the optimal control system for an ethylene cracking furnace. The actual control qualities were improved significantly, and the economic benefits were increased by a multiswarm competitive PSO algorithm based on fuzzy C-means clustering.7 Lin et al. developed a cyclic scheduling model for an ethylene cracking furnace system with inventory constraints to improve the efficiency of ethylene production.8 Tarafder et al. first applied multiobjective optimization to an industrial ethylene reactor to increase the profits.9 Nabavi et al. solved several multiobjective optimization problems of an industrial LPG thermal cracker, involving maximization of the annual ethylene/propylene production, selectivity, and run period and minimization of severity and total heat duty per year.10 Furthermore, cracking process simulation software has been developed and applied to the modeling and optimization of the cracking furnaces.11,12
With the awareness of environmental protection in recent years, many scholars have started to address the issues of energy savings and emission reduction. Some researchers mainly focused on the prediction and reduction of the pollution. Gierow et al. employed artificial neural networks to develop CO and NOx models to minimize the NOx emission.13 Others turned to multiobjective optimization and attempted to add energy consumption or pollution emission as another objective function rather than simply maximizing the profits or yields. The two most popular traditional methods to solve the multiobjective optimization problems are the weighted-sum approach and the epsilon constraint method.14,15 However, several multiobjective evolutionary algorithms emphasizing nondominated solutions in an evolutionary algorithm population have also been suggested over the years.14 Su et al. carried out a short-term scheduling model for cracking furnaces under raw materials and energy consumption limitations.16 Zhang developed a scheduling model considering nonhomogeneous last-batch ending and furnace load makeup. The new environmental concern of background air-quality-conscious decoking and the scheduling solution obtained will cause fewer adverse environmental impacts on ground-level ozone and PM.17 Yu et al. developed a new cyclic scheduling model for a cracking furnace system considering feeds, product prices, decoking costs, and other practical constraints to maximize the profits and minimize fuel consumption.18 Cui et al. proposed a constrained competing evolutionary membrane algorithm and applied it to the ethylene cracking process. The solutions lead the ethylene cracking process to reach the coordinated optimum ethylene or propylene production, fuel consumption reduction, and carbon dioxide emission reduction.19 Wang et al. improved the production efficiency while reducing the total energy consumption of an ethylene plant with a hybrid multiobjective optimization model integrating the nondominated sorting genetic algorithm-II (NSGA-II) and a genetic algorithm with an artificial neural network.20 Geng et al. designed a multiobjective operation optimization strategy and a comprehensive evaluation method of solutions to efficiently solve the multiobjective operation optimization problem of an ethylene cracking furnace, and the yield of ethylene was improved, while the steam consumption was reduced.21 Dai identified the energetic, economic, and environmental aspects as being extraordinarily significant for the sustainable development of the olefin industry. A study was carried out on the energetic, economic, and environmental (3E) multiobjective optimizations of the ethylene separation process.22 Cong et al. proposed a reference-point-based competing evolutionary membrane algorithm to solve the multiobjective optimization problem of the ethylene cracking process. The solutions brought energy savings and emission reduction.23
The aforementioned works managed to reduce the environmental impacts of olefins processing. However, these studies mainly concentrated on the production process of the olefins. Far too little attention has been paid to the energy consumption and pollution emission in extracting, processing, and transporting the feedstock and other secondary materials. To achieve energy-saving and emission-reduction goals, the selection of the feedstock and the consumption of all raw materials should also consider the effects of the process mentioned above on the environment. Life cycle assessment (LCA) is a tool to assess the potential environmental impacts and resources used throughout a product’s lifecycle.24 The concept of LCA was created in the 1970s. A general methodological framework has been defined with the publication of the standardization works ISO 14040 and ISO 14044 during the past decade of the 20th century and the first decade of the 21st century. As ISO never aimed to standardize LCA methods in detail and there is no standard agreement on interpreting some of the ISO requirements, diverging approaches have been developed with regard to system boundaries and allocation methods.25
As the life cycle assessment evaluates the environmental impact from extracting the raw materials to the waste disposal of the product, the entire process is often referred to as “cradle to grave”. Ibbotson et al. conducted a screening LCA of a linear meter I-beam made from stainless steel and a composite. The normalization results showed that a one linear meter composite I-beam has less of an environmental footprint in comparison to that of a stainless steel I-beam in all impact categories.26 Bhatt et al. performed a comparative cradle to grave LCA of a low-impact-development (LID) parking lot test site and discussed the superiority of the LIDs over the detention pond.27 LCA can also adopt a “cradle-to-gate” approach, which means that the study stops at the factory’s gate: the manufacturing product end of life is not considered.28 Rostkowski et al. developed an LCA for the synthesis of polyhydroxy butyrate (PHB) from methane with subsequent biodegradation of PHB back to biogas and discussed the energy requirement of different PHB recovery methods.29 Several studies have also applied the LCA to multiobjective optimization since the field of multiobjective optimization has largely been completed.28 You et al. carried out a life cycle optimization of biomass to liquid supply chains with distributed–centralized processing networks.30 Jing et al. employed LCA to assess and compare the whole life energy saving potentials and pollutant emission reductions of a building cooling, heating, and power (BCHP) system with the traditional energy system, and energy consumption and three pollutant-related impacts were selected as objective functions to optimize the gas engine capacity of the BCHP system in different operation strategies.31 To satisfy the growing maintenance demands of the pavement, Huang et al. proposed an integrated methodology unifying LCA, life cycle cost assessment (LCCA), and multiobjective optimization.32 Tian et al. conducted a holistic LCA using both attributional and consequential approaches to pursue photovoltaic technologies of high efficiency and low production cost.33 A consequential life cycle optimization framework integrated by superstructure optimization, techno-economic analysis methodology, and the consequential LCA approach was developed by Zhao et al. to minimize the environmental impacts and maximize the economic performance.34 Nicoletti et al. studied a single-leader–multiple-follower structure of the multistakeholder crude oil supply chain problem. LCA was used to estimate the environmental impacts for the leader.35
LCA requires a great deal of data, and setting up inventory data can be one of the most labor and time intensive stages of an LCA. Thus, many databases have been developed to facilitate the LCA and avoid duplication in data compilation.24 The Chinese Life Cycle Database,36 Federal LCA Commons,37 and many other studies38−40 provide the basic data for this study. A multiobjective economic and environmental optimization model is formulated on the basis of the LCA data collected. The COT, SHR, and feed flow rate were selected as decision variables. The novelty of this paper is summarized as follows:
An LCA-based multiobjective optimization framework is proposed for the steam cracking process.
The economic and sustainable objective functions are developed utilizing industrial and simulation data.
An industrial case study is carried out to show the advantages of the proposed method.
The rest of this paper is organized as follows. Section 2 briefly introduces the cracking furnace and life cycle assessment method. The proposed LCA-based multiobjective optimization model is developed in section 3. Section 4 presents the case study and the results. Section 5 concludes this paper.
2. Problem Statement
2.1. Ethylene Cracking Furnace
An ethylene cracking furnace linked with transfer line exchangers (TLEs) is illustrated in Figure 1. The ethylene cracking furnace is always operated with TLEs in an ethylene plant. First, feed is sent into a cracking furnace and mixed with dilution steam in a certain proportion after preheating. Through the convection section, the temperature of the feed/steam mixture increases to about 500–600 °C. Then the mixture enters the cracking tubes, located in the firebox with a complex arrangement. In the cracking tubes, the mixture is heated to high temperatures, where the thermal cracking reaction of the feed takes place. The coil outlet temperature (COT) can control the cracking reaction degree. Different COTs will result in various product profiles. At high temperatures, the secondary reaction will deteriorate the yield of desirable products such as ethylene and propylene. The TLEs are used to cool the hot cracked gas to reduce the secondary reaction. Through TLEs, the secondary reaction can be sharply reduced, and meanwhile, the huge heat energy recovered can generate superhigh-pressure steam (SS). The coke deposition will occur on the inner surface of the cracking tubes and TLE tubes with continuous operations. The coke in the cracking tubes will increase the heat transfer resistance and decrease the cross-section of the cracking tubes, which will reduce the desired product yields. For the coke in the TLE tubes, the heat transfer resistance will increase, the SS flow rate will decrease, and the TLE temperature (TLEOT) will increase. A high TLEOT will increase the secondary reaction of the cracked mixture, reducing the desired product yields. Thus, the TLEOT should be monitored to ensure to not exceed the upper boundary. As a result, the feed flow rate, SHR, and COT are selected as the operational variables, and TLEOT is chosen as the constraint.
Figure 1.

Schematic of an ethylene cracking furnace linked with TLEs.
2.2. Life Cycle Assessment
A life cycle assessment consists of four phases: definition of goal and scope, inventory analysis, impact assessment, and interpretation.25 The first phase defines the purpose and the system’s boundary of the assessment. The second phase collects the data for each unit process and sums up the data according to the relation between the different unit processes to obtain the environmental impacts. The third phase is to quantify the environmental impacts by normalization and weighting. The last phase is to identify the environmentally significant issues and assess the LCA’s completeness, sensitivity, and consistency.
This work aims to optimize the steam cracking process to increase profits and reduce emissions. The scope of LCA in this paper is the cracking process. The processes related to the feed flow rate, COT, and SHR are included correspondingly. Life cycle boundaries of ethylene production are illustrated in Figure. 2. The life cycle of the feed is traced back to oil extraction. The transportation and petroleum refining are also included. Cracking feed and other coproducts from the refinery are allocated according to their physical quantity. As the dilution steam is directly produced in the plant, the transportation part of the dilution steam is neglected. The methane in the product is collected as the fuel, and natural gas complements it if the fuel is not enough. As all the variables depend on the feed flow rate to some extent, the function unit is 1 kg of feed cracking in the furnace. CO2, CH4, SO2, NOx, N2O, CO, volatile organic compounds (VOCs), and particulate matter 10 (PM10) are selected as the pollution gases. The external cost is introduced to evaluate the total loss caused by the pollution gas. It estimates the effect of the pollution gas on the environment and human health over a long time span. As a result, the total emission cost is not an actual number for the profit but just an index. Then, the total pollution gas emissions are transformed to minimize the total emission cost.
Figure 2.

Life cycle boundaries of the steam cracking process.
3. Modeling
This section provides the detailed modeling processes of the cracking furnace and the LCA-based multiobjective optimization model.
3.1. Cracking Furnace Models
The cracking furnace model is the fundamental component of multiobjective optimization. This paper modeled the furnace by COILSIM1D,12 developed at the Laboratory for Chemical Technology of Ghent University, to simulate steam cracking of hydrocarbons in a tubular reactor. COILSIMID includes furnace simulation, TLE simulation, and run period simulation modules. The simulations will converge under different conditions, such as fixed COT, conversion rate, or yields of special products. It also includes a feedstock reconstruction. In theory, it can simulate the cracking process for any feedstock if the detailed components are given.11 The reaction network of COILSIM1D is a radical scheme consisting of a monomolecular μ network and a β network. The model equations contain the different species’ continuity equations, energy balance, and pressure equations. These equations are integrated with the reactor coil, resulting in the product yields and the pressure and temperature profiles.11 On the basis of the feedstock’s molecular composition, the reactor’s geometry, and the operating conditions, the product distribution, temperature, pressure, and heat flux at different axial positions throughout the reactor can be obtained by COILSIM1D. After the mechanism model is developed using COILSIM1D, the surrogate model is often used to reduce the computational time. However, the computational time of COILSIM1D is acceptable in this work. All of the furnace information is from the actual furnace, and the industrial data are used to validate the model. Therefore, the model is defined as eq 1
| 1 |
where yieldi is the yield of the product i and Ffeed, TCOT, and SHR are the feedstock flow rate, the coil outlet temperature, and the ratio of steam and hydrocarbon of the furnace, respectively.
As the fuel consumption, SS production, and TLEOT can be measured in the ethylene plant, data-driven models have been developed for the optimization problem using the process data, as respectively shown in eqs 2–4
| 2 |
| 3 |
| 4 |
where aFG,1, aFG,2, aFG,3, bFG, aSS,1, aSS,2, aSS,3, bSS, aTLE,1, aTLE,2, aTLE,3, and bTLE are the parameters of models obtained by the industrial data.
3.2. Multiobjective Optimization Model
The environmental objective is calculated by an LCA-based model to estimate the emission of the steam cracking process. The economic objective calculates the profit of the steam cracking process.
3.2.1. LCA-Based Environmental Impact Model
The emissions in this paper consist of CO2, CH4, SO2, NOx, N2O, CO, volatile organic compounds (VOCd), and particulate matter 10 (PM10). The total emission can be calculated as the sum of the emission of every unit process. The emission of the oil extraction, petroleum refining, oil transportation, and feed transportation, which is related to the feed flow rate, can be respectively calculated as eqs 5–8
| 5 |
| 6 |
| 7 |
| 8 |
where Pf is the petroleum consuming factor, which is calculated by the mass fraction given in Table S1 in the Supporting Information. efj,OE is the emission factor of the gas j in the oil extraction, and efj,PR is the emission factor of the gas j in the petroleum refining. efj,kpetro is the emission factor of the gas j in the petroleum product transportation mode k, and Dk is the distance in the transportation mode k.
The emission of the natural gas extraction and transportation which are related to the feed flow rate, fuel consuming and product yield can be respectively calculated by eqs 9 and 10:
| 9 |
| 10 |
where yieldCH4 is the cracking yield of CH4, efj,NGE is the emission factor of the gas j in the natural gas extraction, and efj,kgas is the emission factor of the gas j in the gas transportation mode k. It should be noted that if the fuel needed is less than the CH4 produced by the cracking, the emission of the natural gas extraction and transportation is zero.
The emission of the steam produced, which is related to the feed flow rate and SHR, can be calculated by eq 11
| 11 |
where efSP,j is the emission factor of the gas j in the steam produced.
The emission of the electricity produced, which is related to the feed flow rate, can be calculated by eq 12
| 12 |
where Ef is the electricity-consuming factor and efj,EP is the emission factor of the gas j in the electricity produced.
The emission of the steam cracking is calculated as the sum of the natural gas combusting emission and the pollution gas produced by the cracking (mainly CO and CO2)
| 13 |
where efj,NGB is the emission factor of the gas j in the natural gas combustion.
Thus, the total emission and the emissions cost can be respectively calculated by eqs 14 and 15
| 14 |
| 15 |
where the l is the unit process mentioned above and dfj is the external cost of emission j.
3.2.2. Economic Profit Model
The economic objective is to maximize the profit per unit time. The profit equals the income minus the cost of the steam cracking process:
| 16 |
The income including the gain from the product and from the superhigh-pressure steam is shown as eq 17
| 17 |
where priceiproduct is the price of product i. The cost including the feed cost, the fuel cost, the water cost in the drum, and the dilution steam cost is shown as eq 18:
| 18 |
Due to the price of natural gas being considered the same as the price of CH4, it is not necessary to consider the yield of CH4 and the natural gas consumption separately. In addition, the water consumption in the drum equals the SS production. Therefore, the profit can be expressed with eq 19:
 |
19 |
Thus, the multiobjective problem is shown as eqs 20 and 21:
 |
20 |
| 21 |
3.2.3. Energy Cost Model
An energy cost model is defined to study the difference between the LCA-based environmental impact and the energy-consuming-based environmental impact, shown as eq 22:
| 22 |
The energy cost model consists of the fuel cost model and the electricity cost model. The fuel consumption is calculated as eq 9, but the fuel cost is calculated by the fuel price rather than the emission factor. The electricity consumption is calculated as eq 12, and the electricity price calculates the electricity cost.
3.2.4. Constraint
TTLEOT should not be larger than its upper limitation TupTLEOT in order to ensure safety and efficiency:
| 23 |
The feed flow rate, COT, and SHR should keep within their corresponding bounds as shown in eq 24:
 |
24 |
4. Case Studies
A case based on industrial data from an ethylene plant is studied. In addition, a standard energy-consuming model is introduced as a comparison to evaluate the performance of the proposed framework. The multiobjective optimization problem was solved by NSGA-II.
4.1. Model Validation
The SS prediction model, fuel prediction model, and the TLEOT prediction model are validated by comparing the industrial values and the predicted ones. The results are shown in Figures 3–5.
Figure 3.

Performance of fuel prediction model: (a) model prediction and industrial value; (b) prediction errors.
Figure 5.

Performance of TLEOT prediction model: (a) model prediction and industrial value; (b) prediction errors.
The industrial data are sampled by day in one operation cycle. The furnace starts at sample number 1 and stops working at sample number 90. It can be illustrated from the figures that the trend of the prediction model is the same as that of the industrial data despite some minor errors. As this paper does not consider the time variable, some prediction errors are inevitable. Figures 3–5 show that TLEOT and SS are more significantly affected by time in comparison to the fuel flow rate. The SS production and TLEOT are not stable at the startup stage (samples 1–4). With the operation of the cracking furnace, the coke is accumulating along the tube wall, which eventually causes an increase in TLEOT. These explain the trends in errors in Figures 4 and 5. In general, the prediction errors of the three models are all within 5%, which can be used for multiobjective optimization problems.
Figure 4.

Performance of SS prediction model: (a) model prediction and industrial value; (b) prediction errors.
4.2. LCA Data
The transportation data are estimated according to the actual situation of the plant. The external cost for emissions is used to calculate the emission cost for each unit.40 To distinguish the emission cost from the profit, we use the monetary unit (mu) to represent the value of external cost. Table S2 in the Supporting Information gives the detailed emission factors of each unit process. Table S3 in the Supporting Information gives the external cost of each emission. The emission cost of each unit process can be calculated accordingly, as shown in Table 1. As the emission cost in the functional unit is not fixed but is related to all the three variables (feed flow rate, COT, and SHR), Table 1 does not show the emission cost in the functional unit but in the unit of each process. Then the emission cost in the functional unit (1 kg of cracking feed) can be calculated according to eqs 5–15.
Table 1. Emission Cost of Each Unit Process.
| oil extraction (mu/kg oil) | NG extraction (mu/kg NG) | electricity produced (mu/(kW h)) | |
|---|---|---|---|
| emission cost | 0.154 | 0.488 | 0.427 |
| steam produced (mu/kg steam) | petroleum refining (mu/kg cracking feed) | NG combusting (mu/kg NG) | |
|---|---|---|---|
| emission cost | 0.198 | 0.256 | 0.456 |
| gas pipeline transportation (mu/kg NG 1 km) | petroleum pipeline transportation (mu/kg oil 1 km) | liquid sea-tanker transportation (mu/kg oil 1 km) | |
|---|---|---|---|
| emission cost | 1.11 × 10⁻² | 6.37 × 10⁻³ | 2.37 × 10⁻² |
4.3. Results
The steam cracking model is developed in COILSIM1D. The LCA models and NSGA-II are programmed in VB.net and run on an Intel Core i7-8750CPU@2.20 GHz personal computer with 32 GB RAM. In NSGA-II, the population size is 30, the generation number is 50, the crossover coefficient is set as 0.9, and the mutation coefficient is set as 0.33. The constraints in eqs 21 and 22 are given in Table 2. The computational time is 160 min. The result is shown in Figure 6.
Table 2. Constraints of the Optimization Model.
| variable | lower bound | upper bound |
|---|---|---|
| Ffeed (th) | 39 | 45 |
| Tcot (°C) | 795 | 825 |
| SHR | 0.4 | 0.7 |
| TTLEOT (°C) | 510 |
Figure 6.

Pareto front of the multiobjective optimization problem.
A tradeoff between profit minimization and emission cost is shown in Figure 6. As can be observed, the reduction in the emission cost can only be achieved by the loss of profits. Points A and F are the extreme values of two objectives in the Pareto front. At point A, the profit and emission cost reach the maximum (87134 CNY/h and 63249 mu/h). At point F, the profit and the emission cost are at a minimum (72170.93 CNY/h and 52921.22 mu/h). Therefore, pointd A and F are both not a good choice for the decision maker as a result of ignoring the other objective.
Points B and E are the points in the inflection area. From point A to point B, the emission cost decreases by nearly 3.36% at the cost of almost 0.78% loss of profits. A rapid decrease in emission cost can be observed in comparison to a slight loss of profits. The reason is that the feed flow rate reaches the upper bound near point B. From point B to point A, an increase in profits can only benefit from an increase in the product yields by raising the COT and SHR. However, increasing COT causes higher fuel consumption and increasing SHR causes higher consumption of dilution steam. Thus, the emission cost increases.
In contrast, the emission cost decreases by approximately 0.45% at about a 4.06% loss of profits from point E to point F. The reason is that the feed flow rate and the SHR both reach the lower bound near point E. From point E to point F, the decrease in emission cost is mainly because of the lower fuel consumption by lowering COT but lowering COT causes reducing a couple of product yields, thus resulting in a slump in the profits. From point B to point E, the emission cost decreases by approximately 13%, while the profit decreases by nearly 13%. As a result, the solutions in the front between points C and D are acceptable. The profit is 83339.98 CNY/h, and the emission cost is 58941.42 mu/h at point C. Furthermore, the profit is 79051.52 CNY/h, and the emission cost is 55873.04 mu/h at point D.
Note that the SHR is near the lower bound for most operating conditions. Usually, high COT, high SHR, and high feed flow rate result in high product yields. As shown in Figure 7, the yields of ethylene and propylene increase with an increase in SHR, but the yields of methane decrease simultaneously with an increase in SHR. However, increasing the SHR increases the consumption of dilution steam and fuel. These will decrease the profits. However, if the yields of other products rise fast enough, the SHR can still be high. As shown in Figure 7, the growth of propylene is stable with an increase in SHR, while the growth of ethylene slows down in the range of 0.55–0.6. This explains why the profit reaches the maximum at point A with an SHR value of 0.57.
Figure 7.

SHR relative to the yields of ethylene, propylene, and methane.
A multiobjective optimization problem to minimize the energy cost and maximize the profit has been carried out to study the difference between the LCA-based environmental impact model and the usual energy-consuming environmental impact model. The Pareto front for the comparison problem is shown in Figure 8.
Figure 8.

Pareto front for the comparison problem.
At point G, the profit is 86861.35 CNY/h and the energy cost is 3980.13 mu/h. At point I, the profit is 75241.32 CNY/h and the energy cost is 3177.15 mu/h. The profit decreases by nearly 13.38%, while the energy cost decreases by approximately 20.17% from point G to point I. In general, the Pareto front in Figure 8 resembles the point B to point E part of the Pareto front in Figure 7. Significantly, the SHR is still always near the lower bound and is even fixed. The reason is the yield of methane, as was mentioned above. Due to the energy cost consisting of only fuel cost and electricity cost, the effect of the methane yield is much more substantial. As a result, there is no inflection at point G in the Pareto front of the energy cost. Although the yields of propylene increase with a decrease in COT, the yields of ethylene and methane decrease simultaneously with a decrease in COT, as shown in Figure 9. Consequently, the profit and energy cost hardly increase with a decrease in the COT, and the COT in the Pareto front of the energy cost is always near the upper bound.
Figure 9.

COT relative to the yields of ethylene, propylene, and methane.
We selected some optimal points from both problems, of which profits are at the same level to calculate their emission cost. The results are shown in Table 3, which are compared with the optimal points from the Pareto front for the emission cost problem. The result shows that, when the profits of the two problems are at the same level, the emission cost and feed flow rate are also at the same level. However, the COT with the emission cost model is slightly lower than that of the energy cost model, while the SHR is marginally higher.
Table 3. Comparison between Two Models.
| emission cost model |
energy cost model |
|||||
|---|---|---|---|---|---|---|
| 1 | 2 | 3 | 1 | 2 | 3 | |
| profit (CNY/h) | 75226.1 | 79499.3 | 86820.4 | 75241.3 | 79475.6 | 86861.3 |
| emission cost (mu/h) | 53162.0 | 56161.8 | 61754.2 | 53181.9 | 56119.5 | 61327.9 |
| TCOT (°C) | 822.63 | 823.85 | 823.013 | 825 | 824.94 | 823.94 |
| SHR | 0.40064 | 0.40304 | 0.43987 | 0.40009 | 0.40046 | 0.40011 |
| Ffeed (t/h) | 39 | 41.18 | 45 | 39 | 41.16 | 45 |
Figures 10–12 illustrate the effects of decision variables on profits. As shown in Figure 10, the COT with the emission cost model is slightly lower than that with the energy cost model when the profits are at the same level. In contrast, the SHR with the energy cost model is somewhat lower than the emission cost model when the profits are at the same level, as shown in Figure 11. Finally, Figure 12 indicates that the feed flow rates are almost identical on both sides when profits are at the same level. All of these show the same conclusion from Table 3. In addition, the COT and SHR for the energy cost model are nearly concentrated on a single point. The LCA-based emission cost model, on the other hand, has a broader scope for the decision variables, which is more suitable to optimize the steam cracking process.
Figure 10.
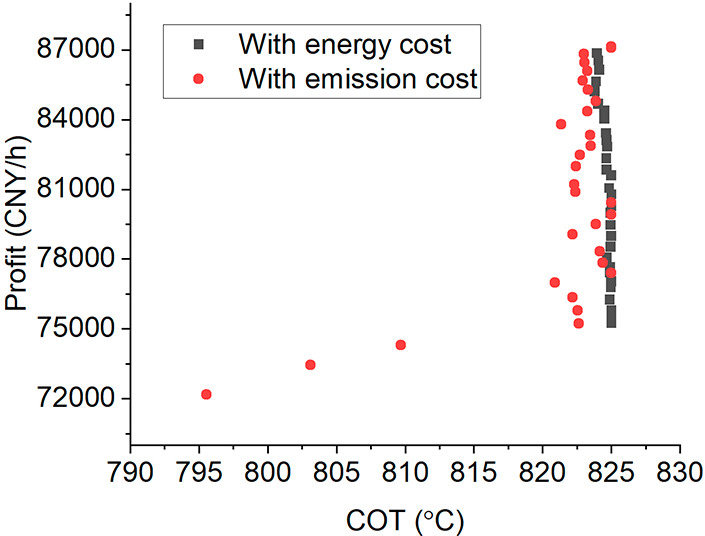
COT relative to profits with emission cost and with energy cost models.
Figure 12.

Feed relative to profit flow rate with emission cost and energy cost models.
Figure 11.

SHR relative to profit with emission cost and energy cost models.
The decision variables relative to the two environmental impact models have been analyzed to find the reason for the differences in profits. The results are shown in Figure 13.
Figure 13.

COT relative to (a) emission cost when SHR = 0.41, (b) energy cost when SHR = 0.41, (c) emission cost when feed = 43t/h, (d) energy cost when feed = 43t/h.
Figure 13a,c show the effects of COT, SHR, and feed flow rate on the emission cost. The emission cost increases with an increase in any of the three decision variables. Notably, the feed flow rate has a more significant effect than the SHR and COT. Figure 13b,d show the effects of COT, SHR, and feed flow rate on the energy cost. The energy cost increases with an increase in either the feed flow rate or SHR and decreases with an increase in COT. Similarly, the feed flow rate also has more significant consequences in comparison to the SHR and COT. Figure 13a,b and Figure 13c,d show the opposite trend of the emission cost and energy cost models when COT is increased. It explains why COT with the energy cost model is concentrated and higher than that with emission cost model. On the other hand, when the COT is lower, it enables the SHR to increase to stabilize the emission cost.
The LCA-based environmental impact model shows a more conflicting relationship with the economic objective in comparison to the standard energy cost model. The scope of the operational variables from the Pareto front is also broader. In this case, the optimum COT of the LCA-based environmental impact model is lower than that integrated with the energy cost model. The optimum SHR of the LCA-based environmental impact model is higher than that of the energy cost model. However, the optimum feed flow rates for the two models are almost the same.
5. Conclusion
This paper proposed a multiobjective environmental and economic optimization framework for the steam cracking process. The LCA method is used to develop the environmental impact model that considers raw material and utility emissions. An industrial case study is carried out to indicate the effectiveness of the proposed method. The effects of COT, feed flow rate, and SHR on the two objectives are analyzed. The obtained Pareto front of the profit and emission has also been studied thoroughly. A multiobjective optimization problem integrated with energy cost is used as a comparative study. The results show that the LCA-based environmental impact model is more conflicting with the economic objective in comparison to the energy cost model. As a result, the proposed LCA-based method is more suitable for the multiobjective optimization issue. The obtained nondominated solutions in the Pareto front can help reduce emissions when a reasonable profit is achieved.
Our further studies will expand the LCA-based model from only one cracking furnace to the upstream and downstream units and develop a multiobjective scheduling framework for the ethylene cracking system, which can guide the operators to operate the ethylene plant well.
Acknowledgments
The work was supported by National Key Research & Development Program-Intergovernmental International Science and Technology Innovation Cooperation Project (2021YFE0112800), the National Natural Science Fund for Distinguished Young Scholars (61925305), the National Natural Science Foundation of China (22178103), and the Fundamental Research Funds for the Central Universities (222202217006).
Supporting Information Available
The Supporting Information is available free of charge at https://pubs.acs.org/doi/10.1021/acsomega.2c00189.
Mass fractions of the products froma refinery, emission factors of each unit process, and external cost of the emissions (PDF)
The authors declare no competing financial interest.
Supplementary Material
References
- Fakhroleslam M.; Sadrameli S. M. Thermal Cracking of Hydrocarbons for the Production of Light Olefins; A Review on Optimal Process Design, Operation, and Control. Ind. Eng. Chem. Res. 2020, 59 (27), 12288–12303. 10.1021/acs.iecr.0c00923. [DOI] [Google Scholar]
- Li P.; Li T.; Cao J. Advanced Process Control of an Ethylene Cracking Furnace. Meas. Control (United Kingdom) 2015, 48 (2), 50–53. 10.1177/0020294015571498. [DOI] [Google Scholar]
- Masoumi M. E.; Sadrameli S. M.; Towfighi J.; Niaei A. Simulation, Optimization and Control of a Thermal Cracking Furnace. Energy 2006, 31 (4), 516–527. 10.1016/j.energy.2005.04.005. [DOI] [Google Scholar]
- Lim H.; Choi J.; Realff M.; Lee J. H.; Park S. Development of Optimal Decoking Scheduling Strategies for an Industrial Naphtha Cracking Furnace System. Ind. Eng. Chem. Res. 2006, 45 (16), 5738–5747. 10.1021/ie050129n. [DOI] [Google Scholar]
- Berreni M.; Wang M. Modelling and Dynamic Optimization of Thermal Cracking of Propane for Ethylene Manufacturing. Comput. Chem. Eng. 2011, 35 (12), 2876–2885. 10.1016/j.compchemeng.2011.05.010. [DOI] [Google Scholar]
- Nian X.; Wang Z.; Qian F. A Hybrid Algorithm Based on Differential Evolution and Group Search Optimization and Its Application on Ethylene Cracking Furnace. Chin. J. Chem. Eng. 2013, 21 (5), 537–543. 10.1016/S1004-9541(13)60531-5. [DOI] [Google Scholar]
- Xia L.; Chu J.; Geng Z. A Multiswarm Competitive Particle Swarm Algorithm for Optimization Control of an Ethylene Cracking Furnace. Appl. Artif. Intell. 2014, 28 (1), 30–46. 10.1080/08839514.2014.862772. [DOI] [Google Scholar]
- Lin X.; Zhao L.; Qian F.; Du W.; He W. Data-Driven Modeling and Cyclic Scheduling for Ethylene Cracking Furnace System with Inventory Constraints. Ind. Eng. Chem. Res. 2021, 60 (9), 3687–3698. 10.1021/acs.iecr.0c06085. [DOI] [Google Scholar]
- Tarafder A.; Lee B. C. S.; Ray A. K.; Rangaiah G. P. Multiobjective Optimization of an Industrial Ethylene Reactor Using a Nondominated Sorting Genetic Algorithm. Ind. Eng. Chem. Res. 2005, 44 (1), 124–141. 10.1021/ie049953m. [DOI] [Google Scholar]
- Nabavi S. R.; Rangaiah G. P.; Niaei A.; Salari D. Multiobjective Optimization of an Industrial LPG Thermal Cracker Using a First Principles Model. Ind. Eng. Chem. Res. 2009, 48 (21), 9523–9533. 10.1021/ie801409m. [DOI] [Google Scholar]
- Van Geem K. M.; Reyniers M. F.; Marin G. B.. Taking Optimal Advantage of Feedstock Flexibility with COILSIM1D. AIChE Annuual Meeting Conference Proceeding; 2008.
- COILSIM1D https://www.avgi.be/coilsim1d.
- Gierow E.Utilizing Neural Networks to Minimize NOx-Emissions in a Steam Cracking Furnace; Chalmers University of Technology: 2020. [Google Scholar]
- Deb K. Multi-Objective Optimization. In Search Methodologies; Springer: 2014; pp 419–421. [Google Scholar]
- Rangaiah G. P.; Feng Z.; Hoadley A. F. Multi-Objective Optimization Applications in Chemical Process Engineering: Tutorial and Review. Processes 2020, 8 (5), 508. 10.3390/pr8050508. [DOI] [Google Scholar]
- Su L.; Tang L.; Grossmann I. E. Scheduling of Cracking Production Process with Feedstocks and.Pdf. Comput. Chem. Eng. 2016, 94, 92–103. 10.1016/j.compchemeng.2016.07.023. [DOI] [Google Scholar]
- Zhang S.; Wang S.; Xu Q. Emission Constrained Dynamic Scheduling for Ethylene Cracking Furnace System. Ind. Eng. Chem. Res. 2017, 56 (5), 1327–1340. 10.1021/acs.iecr.6b02822. [DOI] [Google Scholar]
- Yu K.; While L.; Reynolds M.; Wang X.; Wang Z. Cyclic Scheduling for an Ethylene Cracking Furnace System Using.Pdf. Comput. Chem. Eng. 2017, 99, 314–324. 10.1016/j.compchemeng.2017.01.024. [DOI] [Google Scholar]
- Cui Y.; Han Y.; Geng Z.; Zhu Q.; Fan J. Production Optimization and Energy Saving of Complex Chemical Processes Using Novel Competing Evolutionary Membrane Algorithm: Emphasis on Ethylene Cracking. Energy Convers. Manag. 2019, 196 (June), 311–319. 10.1016/j.enconman.2019.05.101. [DOI] [Google Scholar]
- Wang J.; He Y. L.; Zhu Q. X. Energy and Production Efficiency Optimization of an Ethylene Plant Considering Process Operation and Structure. Ind. Eng. Chem. Res. 2020, 59 (3), 1202–1217. 10.1021/acs.iecr.9b05315. [DOI] [Google Scholar]
- Geng Z.; Wang Z.; Zhu Q.; Han Y. Multi-Objective Operation Optimization of Ethylene Cracking Furnace Based on AMOPSO Algorithm. Chem. Eng. Sci. 2016, 153, 21–33. 10.1016/j.ces.2016.07.009. [DOI] [Google Scholar]
- Dai M.; Yang F.; Zhang Z.; Liu G.; Feng X. Energetic, Economic and Environmental (3E) Multi-Objective Optimization of the Back-End Separation of Ethylene Plant Based on Adaptive Surrogate Model. J. Clean. Prod. 2021, 310 (March), 127426. 10.1016/j.jclepro.2021.127426. [DOI] [Google Scholar]
- Cong D.; Shi C.; Cui Y.; Han Y.; Geng Z. Novel Competing Evolutionary Membrane Algorithm Based on Multiple Reference Points for Multi-Objective Optimization of Ethylene Cracking Processes. Chemom. Intell. Lab. Syst. 2021, 217 (March), 104389. 10.1016/j.chemolab.2021.104389. [DOI] [Google Scholar]
- Finnveden G.; Hauschild M. Z.; Ekvall T.; Guinée J.; Heijungs R.; Hellweg S.; Koehler A.; Pennington D.; Suh S. Recent Developments in Life Cycle Assessment. J. Environ. Manage. 2009, 91 (1), 1–21. 10.1016/j.jenvman.2009.06.018. [DOI] [PubMed] [Google Scholar]
- Guinee J. B.; Heijungs R.; Huppes G.; Zamagni A.; Masoni P.; Buonamici R.; Rydberg T. Life Cycle Assessment: Past, Present, and Future. Environ. Sci. Technol. 2011, 45 (1), 90–96. 10.1021/es101316v. [DOI] [PubMed] [Google Scholar]
- Ibbotson S.; Kara S. LCA Case Study. Part 1: Cradle-to-Grave Environmental Footprint Analysis of Composites and Stainless Steel I-Beams. Int. J. Life Cycle Assess. 2013, 18 (1), 208–217. 10.1007/s11367-012-0452-5. [DOI] [Google Scholar]
- Bhatt A.; Bradford A.; Abbassi B. E. Cradle-to-Grave Life Cycle Assessment (LCA) of Low-Impact-Development (LID) Technologies in Southern Ontario. J. Environ. Manage. 2019, 231, 98–109. 10.1016/j.jenvman.2018.10.033. [DOI] [PubMed] [Google Scholar]
- Jacquemin L.; Pontalier P. Y.; Sablayrolles C. Life Cycle Assessment (LCA) Applied to the Process Industry: A Review. Int. J. Life Cycle Assess. 2012, 17 (8), 1028–1041. 10.1007/s11367-012-0432-9. [DOI] [Google Scholar]
- Rostkowski K. H.; Criddle C. S.; Lepech M. D. Cradle-to-Gate Life Cycle Assessment for a Cradle-to-Cradle Cycle: Biogas-to-Bioplastic (and Back). Environ. Sci. Technol. 2012, 46, 9822–9829. 10.1021/es204541w. [DOI] [PubMed] [Google Scholar]
- You F.; Wang B. Life Cycle Optimization of Biomass-to-Liquid Supply Chains with Distributed-Centralized Processing Networks. Ind. Eng. Chem. Res. 2011, 50 (17), 10102–10127. 10.1021/ie200850t. [DOI] [Google Scholar]
- Jing Y. Y.; Bai H.; Wang J. J. Multi-Objective Optimization Design and Operation Strategy Analysis of BCHP System Based on Life Cycle Assessment. Energy 2012, 37 (1), 405–416. 10.1016/j.energy.2011.11.014. [DOI] [Google Scholar]
- Huang M.; Dong Q.; Ni F.; Wang L. LCA and LCCA Based Multi-Objective Optimization of Pavement Maintenance. J. Clean. Prod. 2021, 283, 124583. 10.1016/j.jclepro.2020.124583. [DOI] [Google Scholar]
- Tian X.; You F. Energy and Environmental Sustainability Assessment of Photovoltaics Transition toward Perovskite-Perovskite Tandems from the Attributional and Consequential Perspectives. ACS Sustain. Chem. Eng. 2021, 9, 11247. 10.1021/acssuschemeng.1c03927. [DOI] [Google Scholar]
- Zhao X.; You F. Consequential Life Cycle Assessment and Optimization of High-Density Polyethylene Plastic Waste Chemical Recycling. ACS Sustain. Chem. Eng. 2021, 9, 12167. 10.1021/acssuschemeng.1c03587. [DOI] [Google Scholar]
- Nicoletti J.; You F. Multiobjective Economic and Environmental Optimization of Global Crude Oil Purchase and Sale Planning with Noncooperative Stakeholders. Appl. Energy 2020, 259, 114222. 10.1016/j.apenergy.2019.114222. [DOI] [Google Scholar]
- Software of efootprint Home Page, available online: http://www.efootprint.net/#/home%0A (accessed on 9 August 2021).
- Federal LCA Commons . https://www.lcacommons.gov/ (accessed on 9 August 2021).
- Xiang D.; Yang S.; Li X.; Qian Y. Life Cycle Assessment of Energy Consumption and GHG Emissions of Olefins Production from Alternative Resources in China. Energy Convers. Manag. 2015, 90 (2015), 12–20. 10.1016/j.enconman.2014.11.007. [DOI] [Google Scholar]
- Ou X.; Zhang X.; Chang S. Alternative Fuel Buses Currently in Use in China: Life-Cycle Fossil Energy Use, GHG Emissions and Policy Recommendations. Energy Policy 2010, 38 (1), 406–418. 10.1016/j.enpol.2009.09.031. [DOI] [Google Scholar]
- Pa A.; Bi X. T.; Sokhansanj S. Evaluation of Wood Pellet Application for Residential Heating in British Columbia Based on a Streamlined Life Cycle Analysis. Biomass Bioenergy 2013, 49, 109–122. 10.1016/j.biombioe.2012.11.009. [DOI] [Google Scholar]
Associated Data
This section collects any data citations, data availability statements, or supplementary materials included in this article.