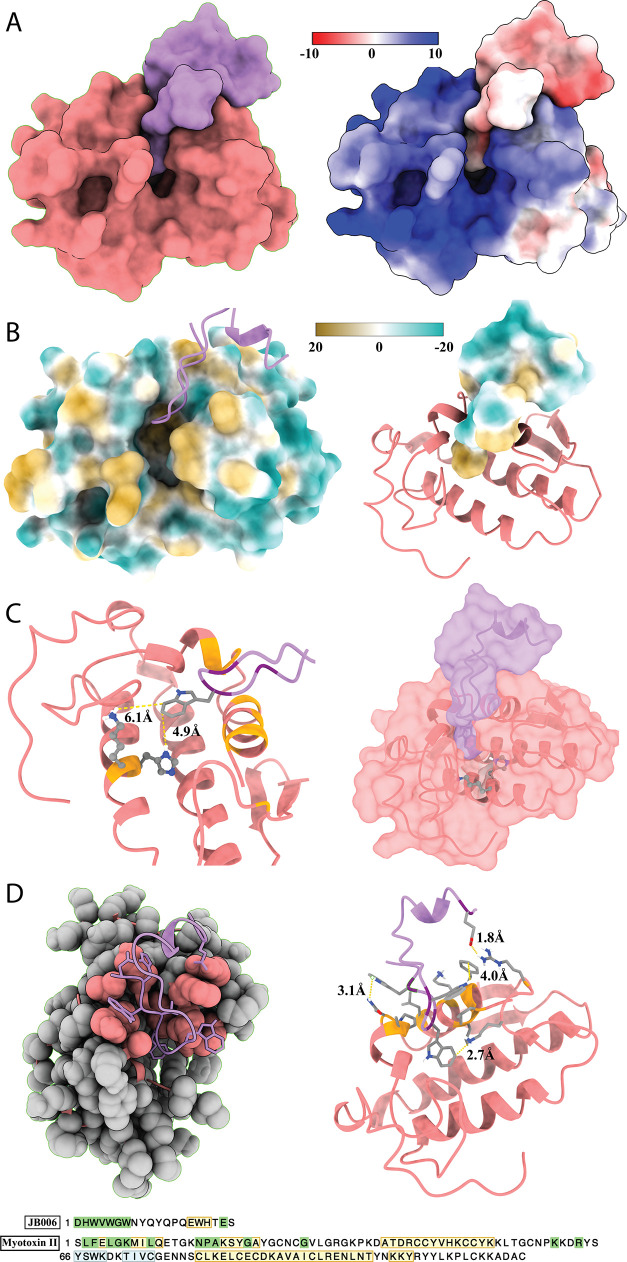
Figure 8.
Molecular docking of JB006 (coral) and myotoxin II (lavender). (A) Shape complementarity and electrostatic charge driving the interactions (Coulombic color was used with red for the negative charge through white to blue for the positive charge). (B) Assessment of molecular lipophilicity potential (the surface coloring ranges from dark goldenrod for the most hydrophobic potentials, through white, to dark cyan for the most hydrophilic). (C) Depiction of the possible steric hindrance of the hydrophobic channel of myotoxin II by JB006. (D) Representation of residues involved in the toxin–peptide interface. “Green” sequence highlights indicate amino acids involved in the interface, “yellow” regions indicate protein structure helices, and “blue” indicates structure strands.

