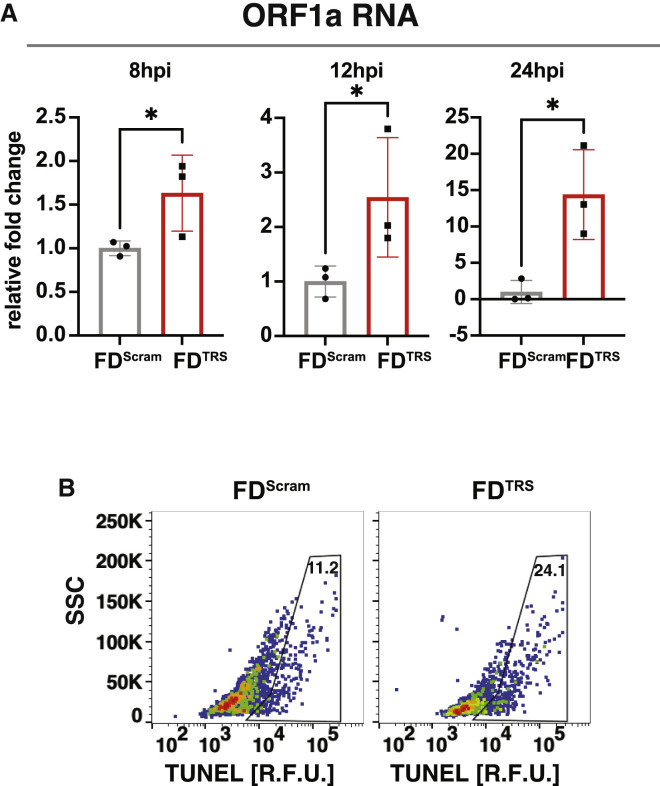
Figure S7.
FDTRS decoys in the context of SARS-CoV-2 infection, related to Figure 7
(A) qRT-PCR analysis for ORF1a expression fold-change at 8, 12, and 24 hpi; Vero cells were nucleofected with 25 μM FDTRS or FDScram and then infected with SARS-CoV-2 (WA-1 strain, MOI = 0.05).
(B) Raw flow cytometry dot plots for apoptosis analysis at 48 hpi by TUNEL assay; Vero cells were nucleofected with 25 μM FDTRS or FDScram and then infected with SARS-CoV-2 (WA-1 strain, MOI = 0.05).

