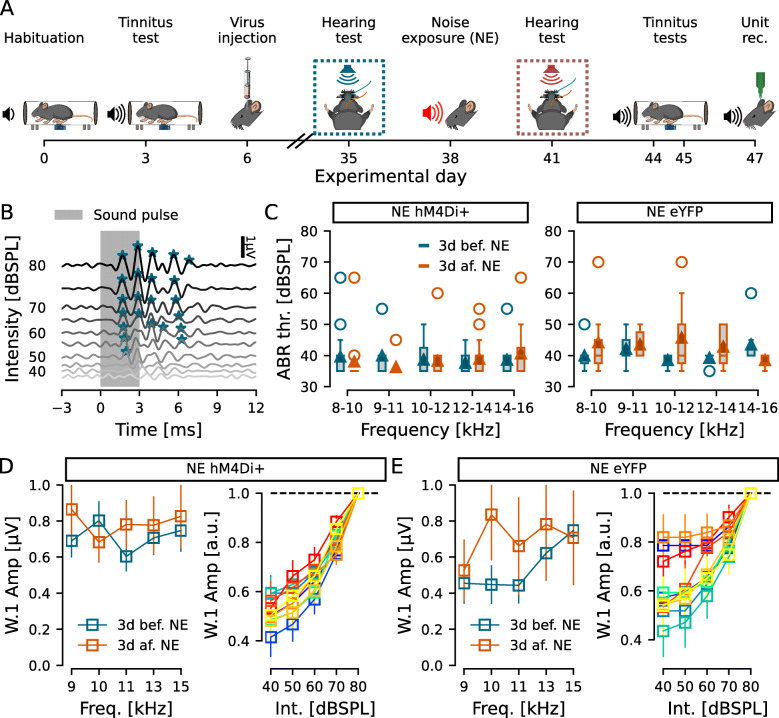
Fig. 1.
Noise exposure did not induce hearing threshold shifts. A Experimental timeline highlighting the ABR recordings before and after noise exposure. B ABR representative example for 8–10-kHz frequency presented from 80 to 35dBSPL. Algorith-detected response peaks are marked with asterisks. Hearing threshold was defined at the last intensity with an identified peak, in this example, 50dBSPL. C Group hearing thresholds for each frequency tested before (blue) and after (orange) noise exposure (NE) for hM4Di (left) and eYFP (right) injected animals. D, E ABR Wave 1 (W.1) amplitudes at 80dBSPL (left) and growth functions (right) for the hM4Di (D) and eYFP (E) injected animals. Left, amplitude of wave 1 for each frequency tested 3d before (blue) and 3d after (orange) nose exposure. Right, wave 1 amplitude at each tested intensity, normalized by amplitude at 80dBSPL, at each tested frequency (cold blue-green colors: 3d before; warm red-yellow colors: 3d after noise exposure). n = 11 and 7 for NE hM4Di+ and NE eYFP, respectively

