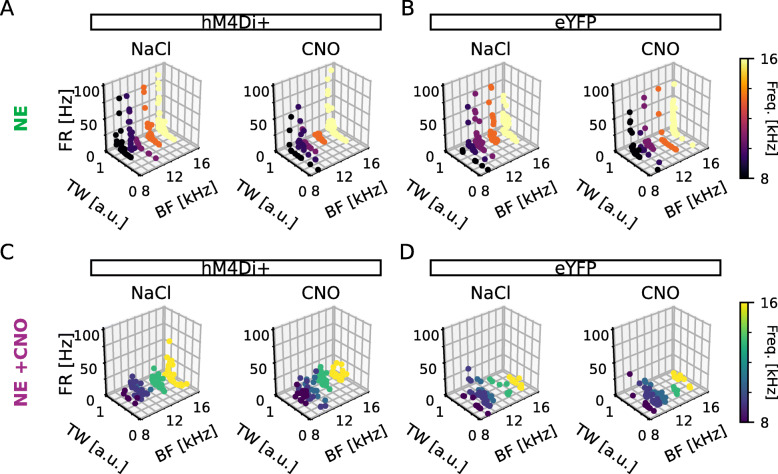
Fig. 7.
Three-dimensional scatter plots of firing rate, tuning width, and best frequency of DCN units of noise-exposed hM4Di+ or eYFP+ animals in the presence of NaCl or CNO. A, B 3D scatters representing each unit by firing rate x tuning width x best frequency for hM4Di (experimental; A and eYFP (control; B animals under NaCl (left) or CNO (right) treatment. C, D Same as A and B for experiments where animals were administered CNO (0.5mg/kg) 30 min prior to noise exposure. Colors represent the best frequency response between 8 and 16kHz. FR, firing rate; TW, tuning width; BF, best frequency; n = 11, 7, 6, and 6 mice; 122, 102, 85, and 91 units; for NE hM4Di+, NE eYFP, NE+CNO hM4Di+ and NE+CNO eYFP, respectively

