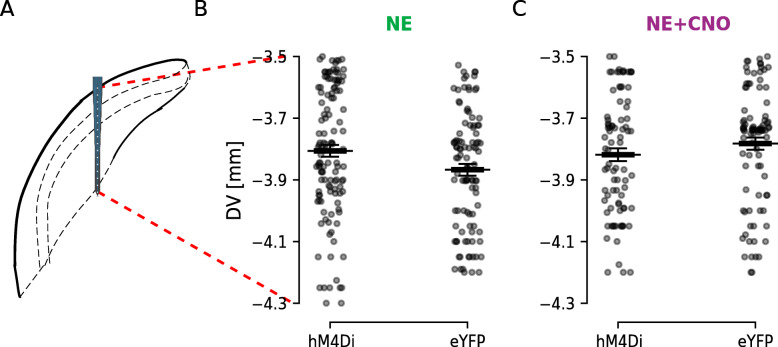
Fig. 8.
DCN unit depth profile. A Schematic representation of the probe location within the DCN according to coordinates used highlighting the dorsoventral depth of unit recordings. B Distribution of recorded DCN units along the dorsoventral axis for noise-exposed animals expressing CaMKII α-hM4Di or CaMKII α-eYFP. C The same as B but for experimental and control animals that were pre-treated with CNO 30 min before noise exposure. Black bars indicate mean ± SEM. n = 11, 7, 6, and 6 mice; 122, 102, 85, and 91 units; for NE hM4Di+, NE eYFP, NE+CNO hM4Di+, and NE+CNO eYFP, respectively

