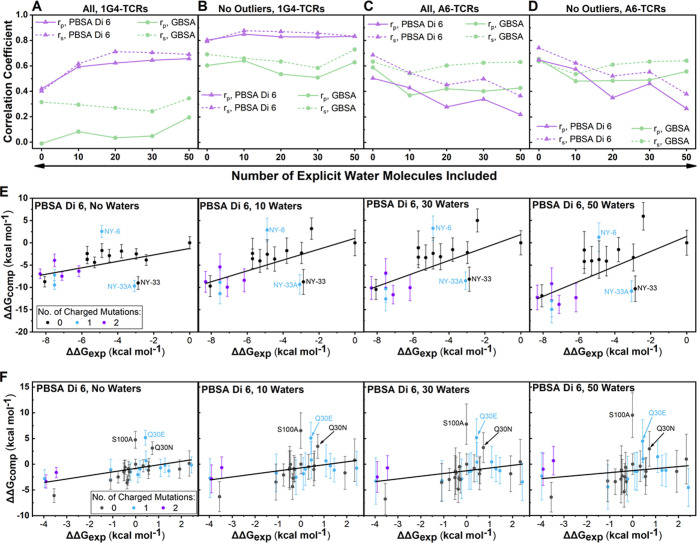
Figure 4.
Impact of explicit water molecules on binding affinity predictions. Determined Spearman’s rank (rs) and Pearson’s r (rp) values for MMPB/GBSA calculations on the 1G4 (A, B) and A6 (C, D) test sets for different numbers of explicit water molecules included in the calculation. Exemplar scatter plots for the 1G4 (E) and A6 (F) test sets showing the impact of the inclusion of an increasing number of explicit water molecules when using the MMPBSA method with ϵint set to 6 (Di 6). Scatter points are colored according to the number of charged mutations made between the variant and the WT. Complete scatter graphs for all results are provided in Figures S5–S8.

