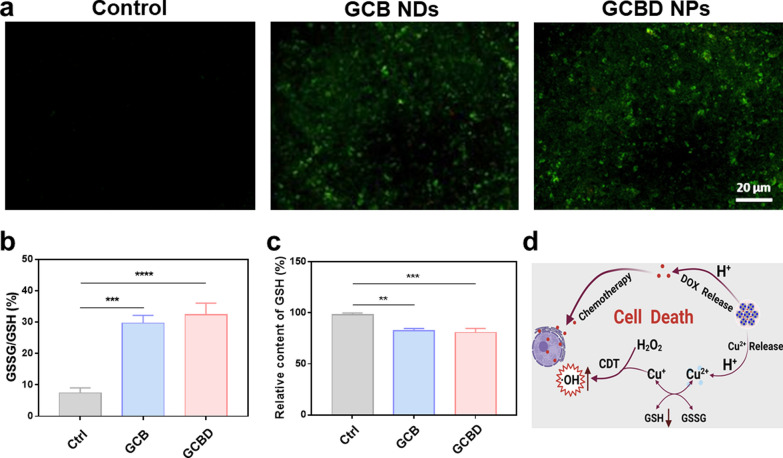
Fig. 4.
In vitro chemo/chemodynamic therapy based on GCBD NPs. a Confocal laser scanning microscopy (CLSM) imaging of 4T1 cells stained with DCFH-DA after various treatments. Scale bar: 20 μm. b The GSSG/GSH ratio of GSH solutions (10 mM) after incubation with PBS, GCB NDs or GCBD NPs for 24 h. c The relative GSH content in 4T1 cells after incubation with different solutions for 24 h. d Schematic illustration showing the mechanism for cellular chemo/chemodynamic therapy based on GCBD NPs. P values in (b, c) were calculated by multiple t tests (****P < 0.0001, ***P < 0.001, ***P < 0.001, **P < 0.01, *P < 0.05)

