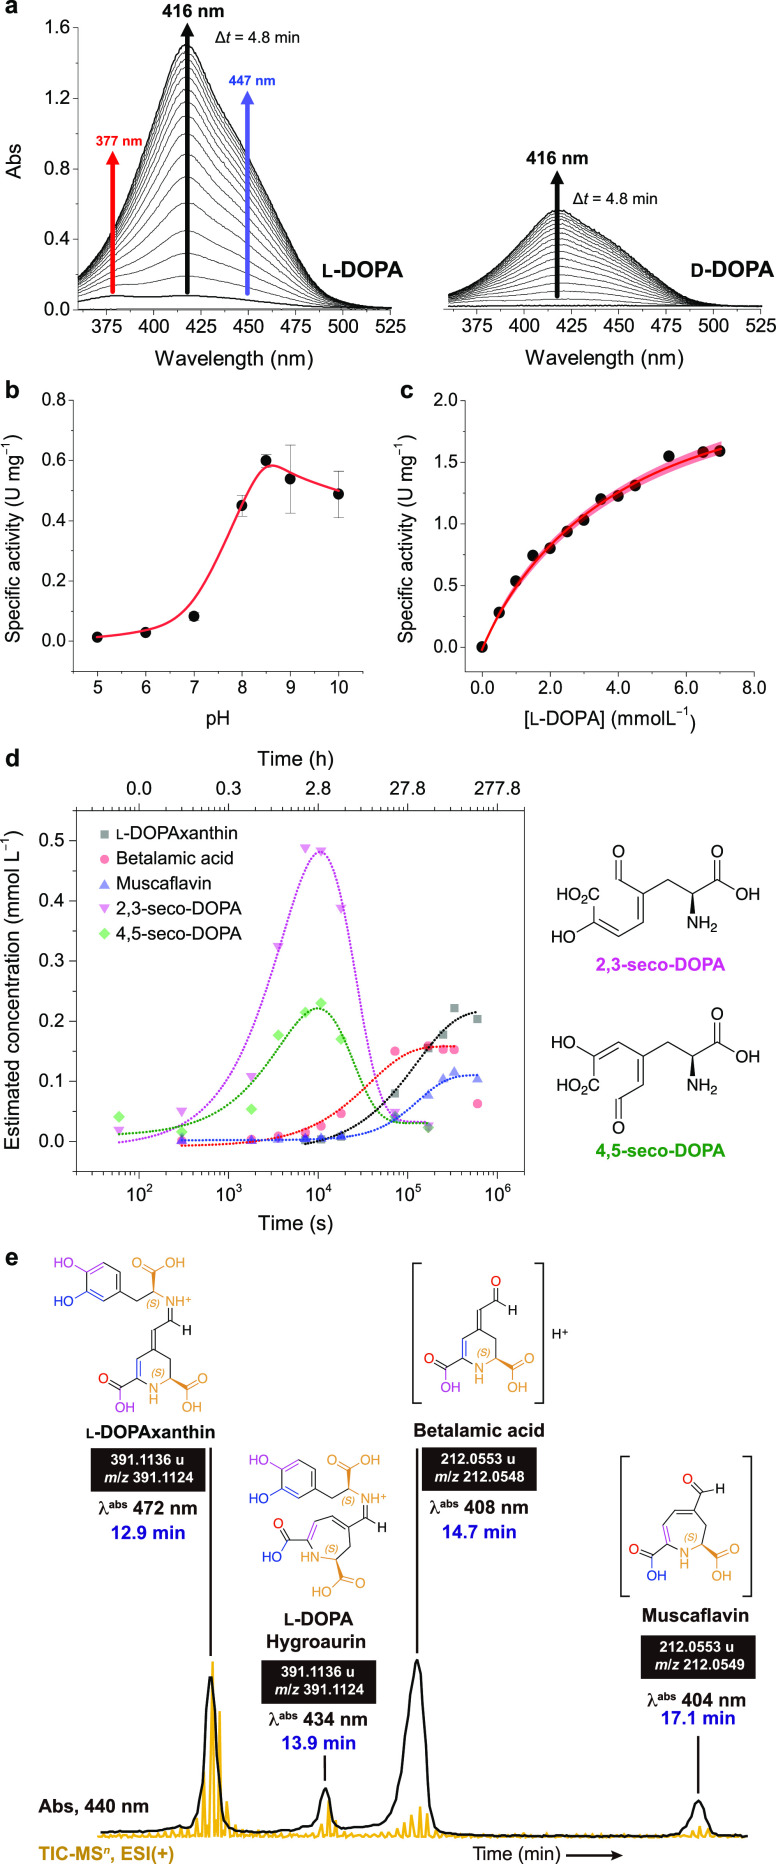
Figure 3.
Enzyme activity. (a) Change in the UV–vis spectra during the reaction of d- and l-DOPA with oxygen in the presence of AmDODA and AscH. Effect of pH (b) and l-DOPA concentration (c) on the specific activity of AmDODA. The red shaded region shows the 95% confidence band for the nonlinear fit of the data to the Michaelis–Menten equation. (d) Kinetic traces of the reaction products and intermediates formed by the oxidation of l-DOPA in the presence of AmDODA. The reaction was monitored for up to 7 d. The structures of the seco-DOPAs are shown for clarity. Chromatograms, peak retention time, absorption spectra, and reaction conditions are shown in Figure S6 and were obtained using the chromatographic condition 1. (e) Chromatogram of products formed after 2 h of reaction at room temperature and a freezing-thawing cycle (chromatographic condition 2). Figure S8 shows the MS2 spectra and ion fragments of muscaflavin and betalamic acid. Experimental conditions: [AmDODA] = 1 μM, [AscH] = 10 mM, [l-DOPA] = 2.5 mM, sodium phosphate buffer (50 mM, pH 8.5).

