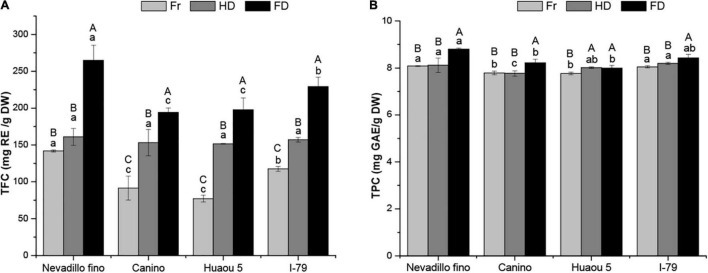
FIGURE 2.
TFC (A) and TPC (B) of dried olive leaves from four cultivars. Fr, HD, and FD denote fresh, hot air-dried, and freeze-dried olive leaf samples, respectively. Data are expressed as mean ± standard deviation (n = 3). Different letters in the different treatments (A to C) and cultivars (a to c) indicate a significant difference (P < 0.05).

