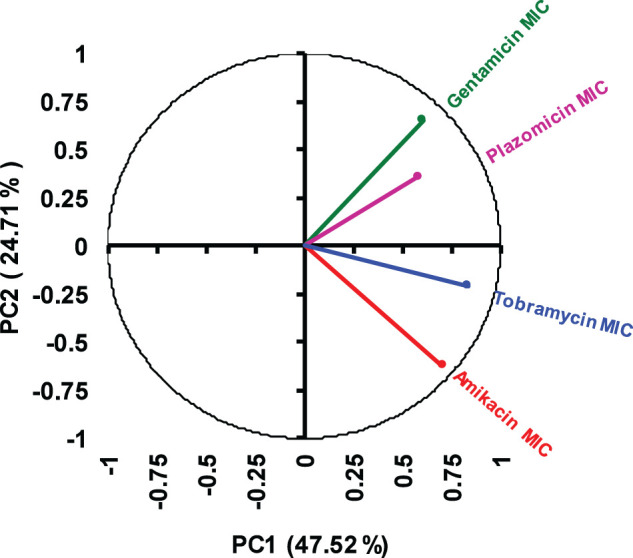
Figure 1.

PCA loading plot of the log2-transformed MIC data of the aminoglycosides for 158 CR-Kp clinical isolates. The plot shows how each aminoglycoside MIC influenced the first and second principal components (PC1 and PC2), which together explained 72.23% of the total variance within the dataset. This figure appears in colour in the online version of JAC and in black and white in the print version of JAC.
