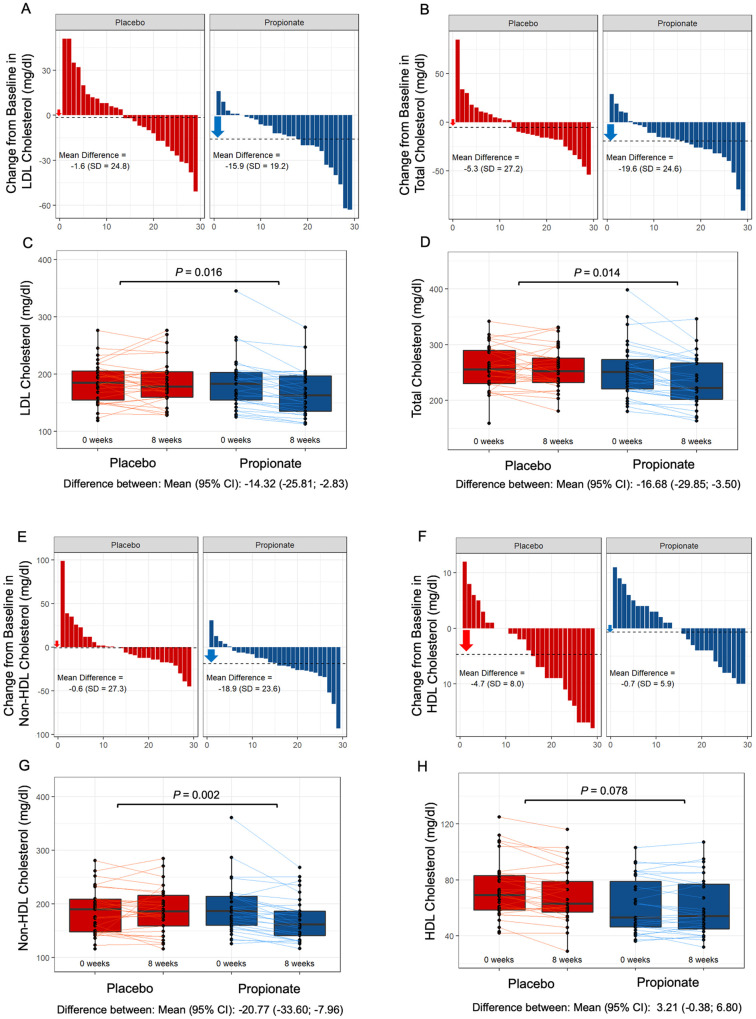
Figure 6.
Oral propionate supplementation lowers blood low-density lipoprotein and total cholesterol levels in hypercholesterolaemic humans. (A and B) Waterfall plots depict the change in low-density lipoprotein and total cholesterol levels a from baseline to Week 8 for each study participant randomly assigned to the placebo group and the propionic acid group. (C and D) Box plots illustrate the distribution of low-density lipoprotein and total cholesterol levels within the placebo (red) and propionate (blue) groups for each timepoint (baseline and after 8 weeks). (E and F) Waterfall plots showing the change in non-high-density lipoprotein and high-density lipoprotein cholesterol levels. (G and H) Box plots demonstrating the distribution of non-high-density lipoprotein and high-density lipoprotein cholesterol levels for each timepoint. The lines depict the raw values at baseline and after 8 weeks. In the box plots, the line in the middle of the box indicates the median, and the lower and upper limits of the box correspond to the 25th and 75th percentiles, respectively. Analysis of covariance was performed to test the delta change between the two groups (placebo n = 29, propionate n = 29). CI, confidence interval; HDL, high-density lipoprotein; LDL, low-density lipoprotein; SD, standard deviation.

