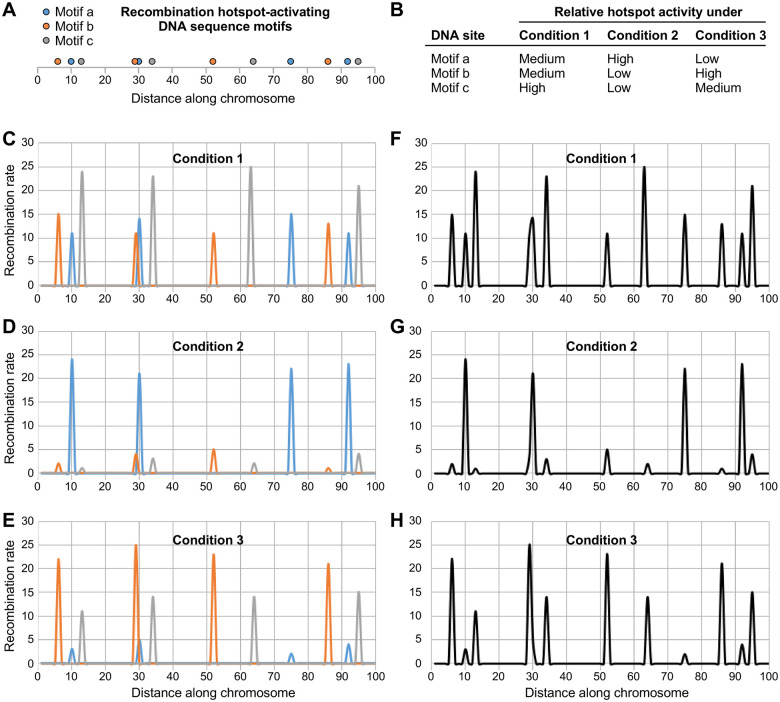
Figure 7.
Model for plasticity in the distribution of meiotic recombination. The magnitudes of dynamic changes in relative hotspot activity depicted here are based on those defined experimentally in this study. For the sake of illustration, rates of recombination (arbitrary units) were assigned at random for low (rate range of 1–5), medium (11–15), and high (21–25) activity of individual hotspots. (A) Conceptual distribution of three different types of hotspot-activating DNA sequence motifs (a, blue; b, orange; c, gray) along the chromosome. (B) Each different class of DNA site-dependent hotspots is regulated independently, through its own binding/activating proteins, in response to changes in environmental and metabolic conditions. (C–E) Contribution of each DNA site to the rate of recombination in its vicinity (blue, orange, and gray lines) under the experimental conditions listed in B. (F–H) Net impact of the three classes of regulatory DNA sites on the overall distribution of recombination (black lines) under the three different conditions. Note substantial differences in the frequency distribution of recombination events. Also note that if one applies a cutoff value for what is a hotspot (e.g., local recombination rate ≥ 10), as is often done in the literature, the number of annotated hotspots and their apparent positions change substantially from condition to condition.

