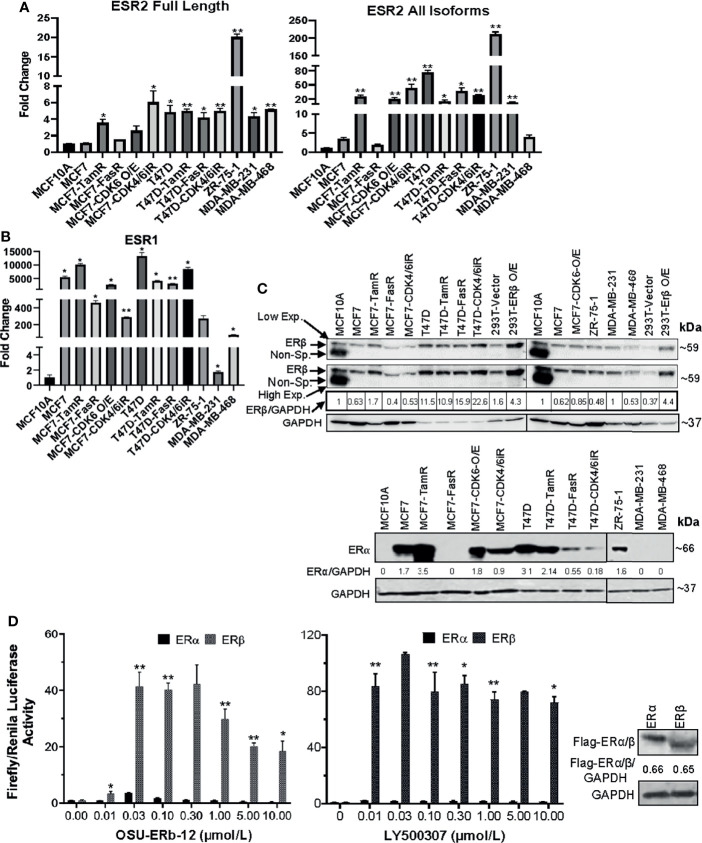
Figure 1.
(A–C) ESR1 and ESR2 genes are differentially expressed in ERα+ parental, respective endocrine-resistant, and triple-negative breast cancer cell lines. (A, B) Expression of ESR1 and ESR2 in immortalized mammary MCF10A, transformed ERα+ MCF7 and T47D, endocrine-resistant MCF7-TamR, MCF7-FasR, T47D-TamR, and T47D-FasR, CDK6 overexpressing MCF7 (MCF7-CDK6 O/E), CDK4/6 inhibitor-resistant MCF7 (MCF7-CDK4/6iR) and T47D (T47D-CDK4/6iR), ZR-75-1, and triple-negative breast cancer (TNBC; MDA-MB231, MDA-MB-468, Hs578t) cell lines. Total RNA was isolated from the established cell lines using TRIzol. The expression of each gene was assessed by quantitative RT-PCR (qRT-PCR) performed with the DNase-treated RNA samples using gene-specific primers spanning exon–exon junctions that include large introns in the corresponding genomic sequence to avoid genomic DNA amplification. Gene expression was calculated by the ΔΔCt method using GAPDH as an internal control. The expression of each gene is shown as the fold change relative to MCF10A. All reactions were done in triplicate, and the experiment was repeated twice. Data were plotted as mean ± SD. (A) ESR2 genes; full length (left) and all isoforms (right). (B) ESR1. (C) Whole-cell lysates were extracted, and immunoblot analyses were performed for ERβ and GAPDH (loading control) (upper panel), and ERα and GAPDH (lower panel). The intensity of the protein bands was quantified using Image Studio (LiCor) software. Numbers under the lanes of each cell line represent normalized values of the corresponding protein band (ERβ or ERα). The normalized band intensity of MCF10A was considered as 1. Immunoblot analyses were repeated twice with corresponding biological replicates. Reproducible results were obtained in each independent experiment. GAPDH, glyceraldehyde-3-phosphate dehydrogenase. For ERβ (upper panel), two different exposures were provided; low exp.= low exposure; high exp.= higher exposure of the blot. (D) ERE-luciferase-driven promoter activity upon treatment with selective ERβ agonists is significantly higher in ectopically expressing cells with ERβ compared to that of ERα. HEK293T cells were transfected with c-Flag pcDNA3 (vector control), c-Flag ERα or c-Flag ERβ in combination with ERE-Luciferase (reporter) and TK-Renilla (pRLTK; internal control) plasmids (as described in Materials and Methods). Forty-eight hours after treatment of the cells with ERβ-specific agonists Renilla and Firefly, luciferase activities were measured using the dual-luciferase reporter assay system. Firefly luciferase was normalized to Renilla Luciferase. Treatment with: OSU-ERb-12 (0–10 µmol/l) (left) and LY500307 (0–10 µmol/l) (middle). Each assay was performed in triplicate with three experimental replicates (mean ± SD, *p < 0.05, **p < 0.01). The right panel shows equal expressions of ERα and ERβ as determined by Western blot analysis using the anti-flag antibody. Intensity of Flag-ERα/ERβ was normalized to GAPDH. The numbers under the corresponding protein band represent normalized values of the corresponding protein band intensity.

