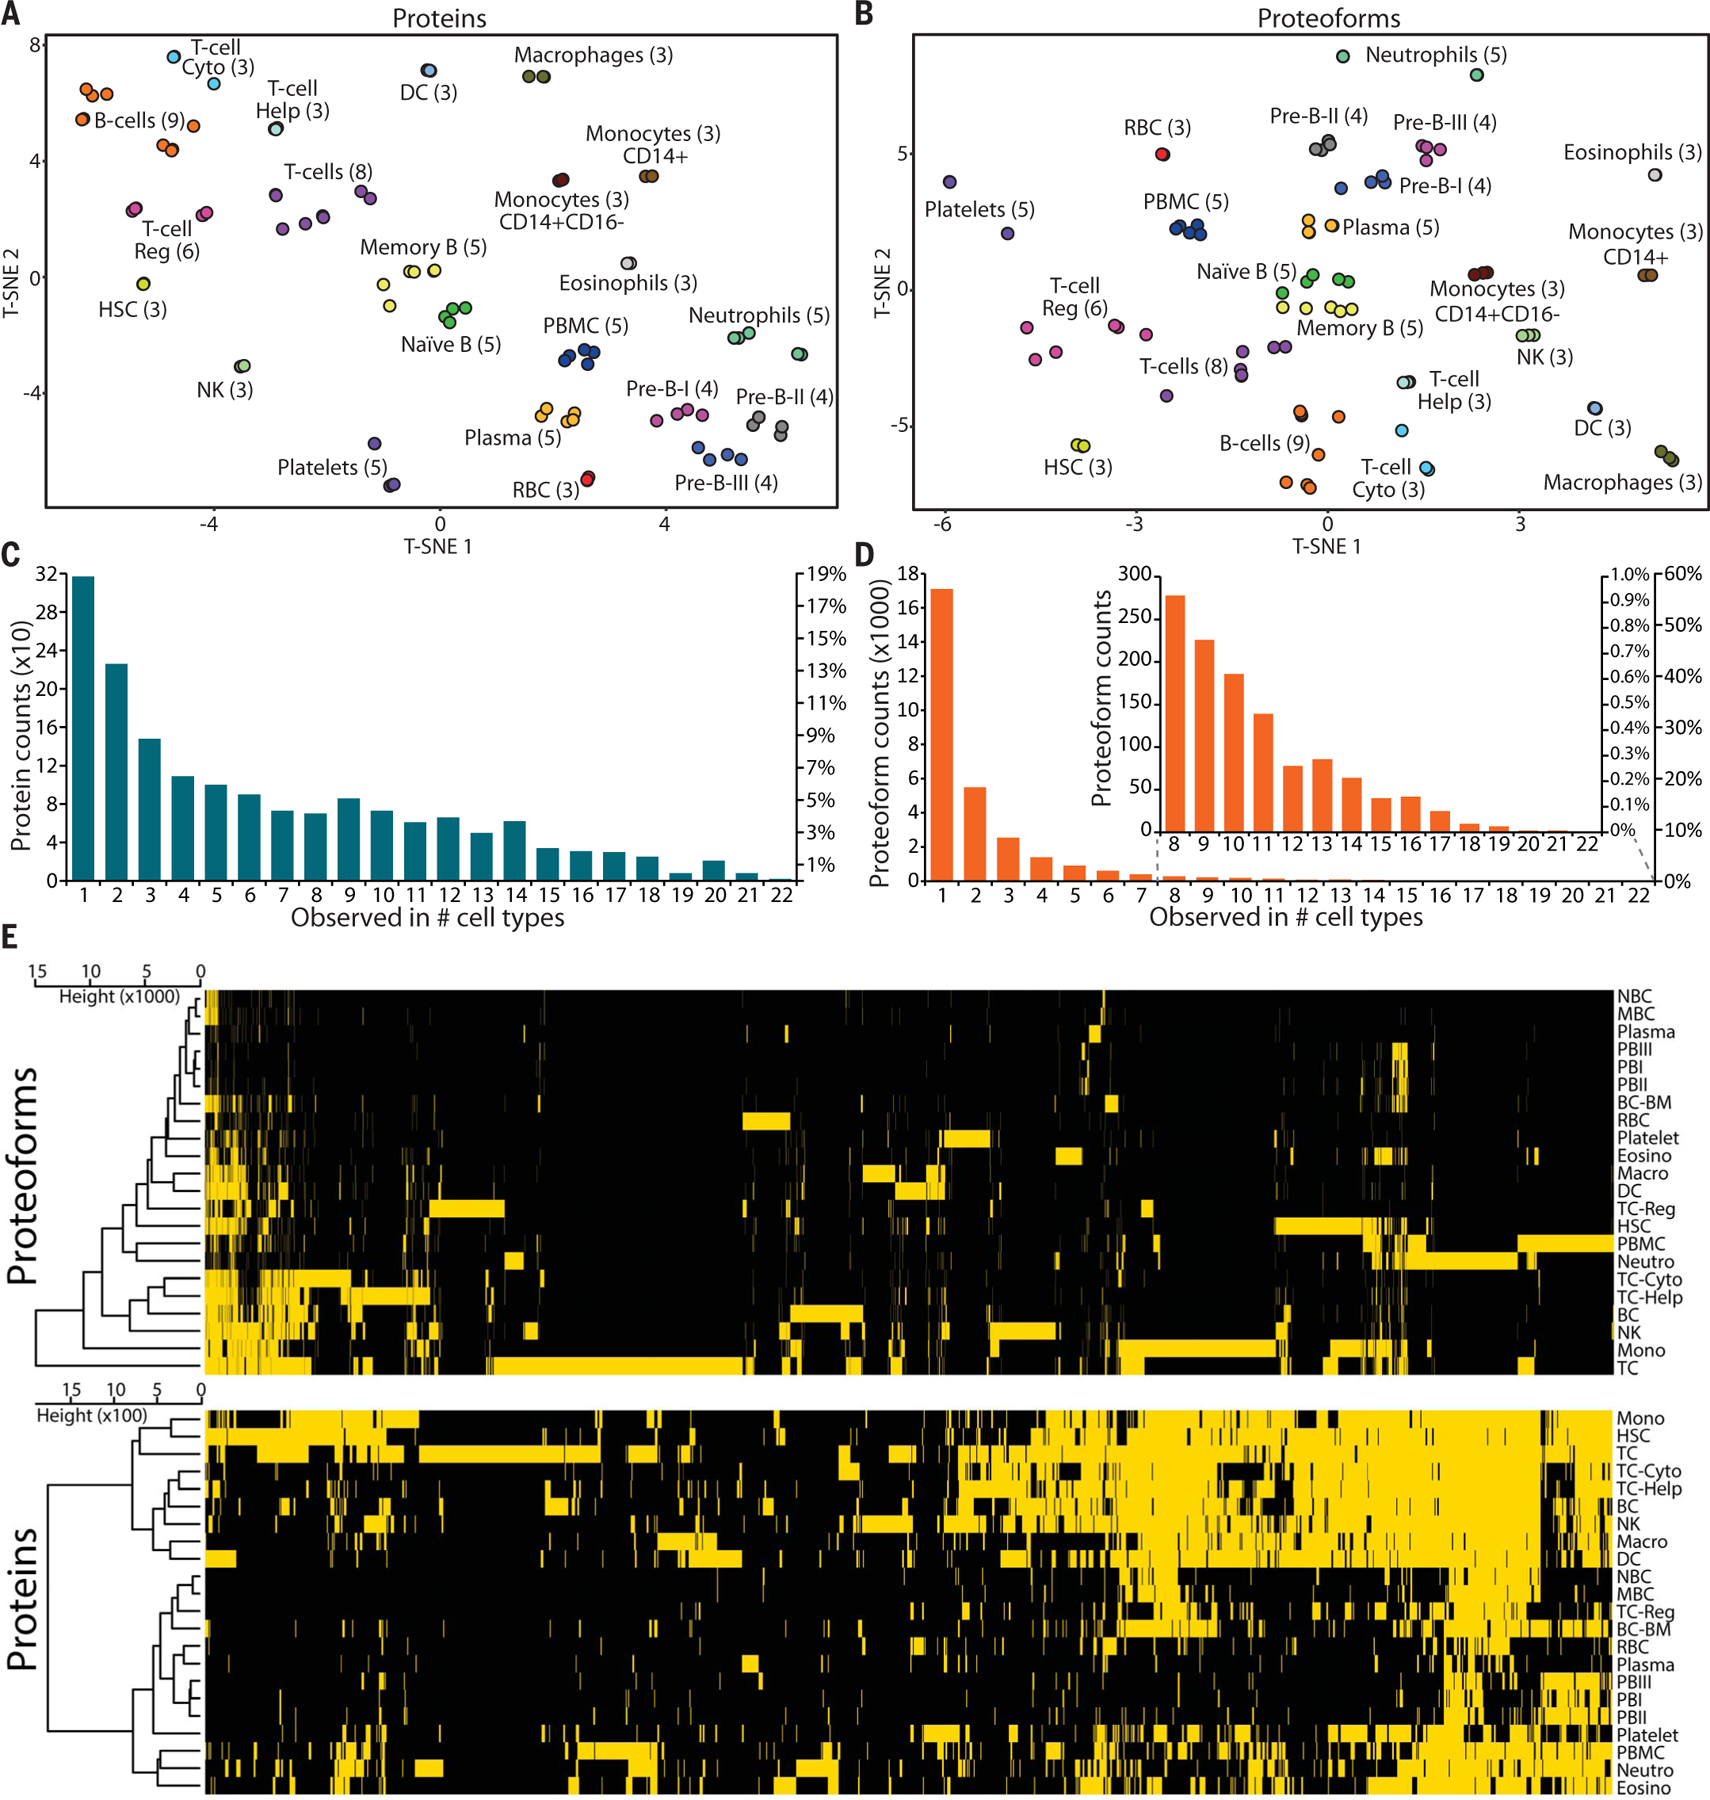
Fig. 2. Display of protein and proteoform analysis for entries in the Blood Proteoform Atlas.

t-SNE plots display cell types grouped by presence or absence of (A) proteins and (B) proteoforms. T-cell Cyto, cytotoxic T cells; T-cell Help, helper T cells; T-cell Reg, regulatory T cells; HSC, hematopoietic stem cells; DC, dendritic cells; RBC, red blood cells. Histograms of (C) proteins and (D) proteoforms shared by different cell types. (E) Heatmaps and cell type hierarchical clustering of identified (yellow) or not-identified (black) proteins (1690) and proteoforms (29,620) at 1% FDR, with proteoforms exhibiting higher specificity for distinct cell types. NBC, naïve B cells; MBC, memory B cells; PBI, pre-B-I cells; BC-BM, B cells from bone marrow; Eosino, eosinophils; Macro, macrophages; Neutro, neutrophils; BC, B cells from blood; Mono, monocytes; TC, T cells.
