
Fig. 5.
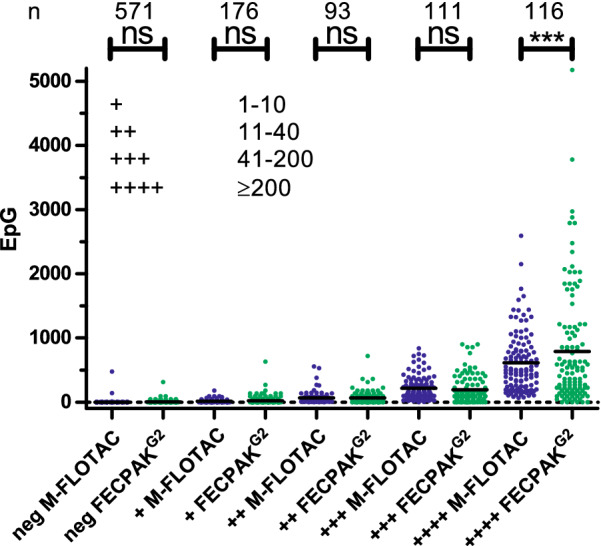
Comparison of strongyle faecal egg counts as epg for each category from the sedimentation/flotation method. Data were analysed by an ANOVA followed by Bonferroni post hoc test to compare M-FLOTAC and FECPAKG2 data within the same category from the sedimentation/flotation method. Means are indicated by black horizontal lines. Categories in the sedimentation/flotation method (negative to + [1–10 eggs], ++ [11–40 eggs], +++ [41–200 eggs], ++++ [> 200 eggs]) are assigned according to the number of eggs counted under the microscope. The number of samples (n) in each category is provided at the top of the figure. Asterisks indicate significance at ***P < 0.001; ns, not significant