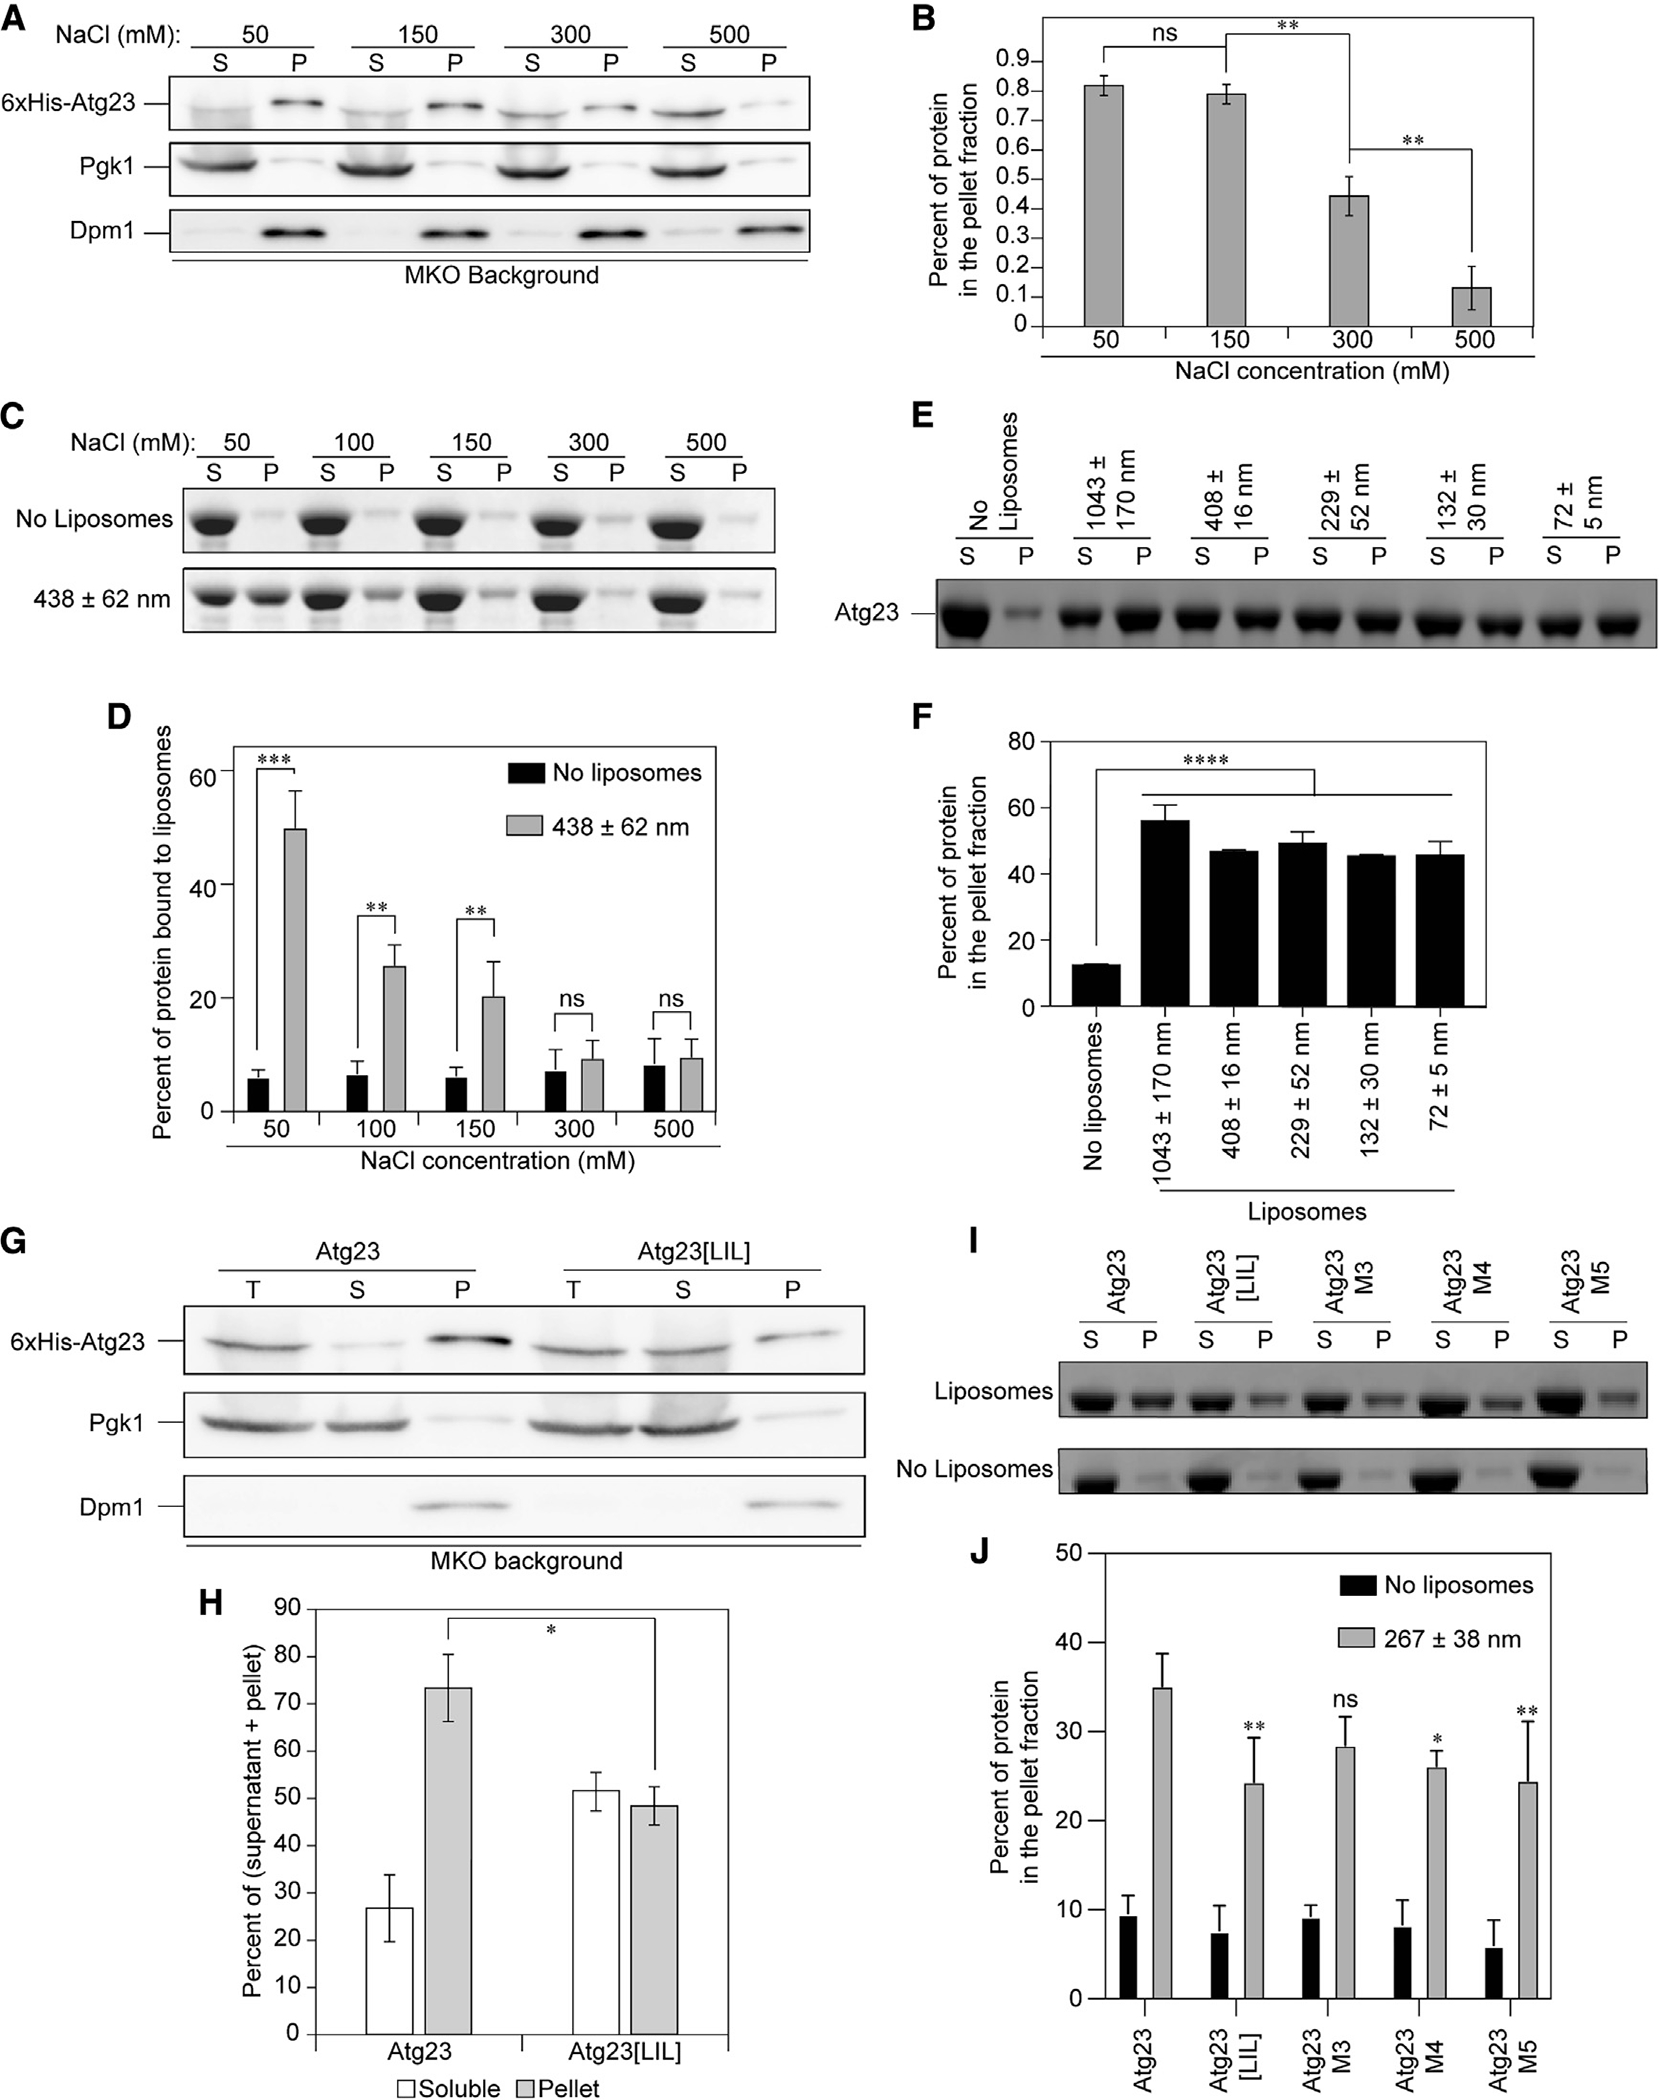
Figure 3. Atg23 is a membrane-binding protein.

(A) 6xHis-Atg23 was overexpressed in the MKO cells and analyzed by subcellular fractionation in the presence of varying salt concentrations. “S” represents the supernatant and “P” the pellet. Pgk1 is included as a soluble protein control and the transmembrane protein Dpm1 as a membrane control.
(B) Quantification of (A). Error bars show standard error of the mean (SEM). n = 3; ns, not significant; **p < 0.01 by Tukey honestly significant difference (HSD) test.
(C) Liposome sedimentation assay with Atg23 and YPL liposomes at the indicated NaCl concentrations. Representative SDS-PAGE gels containing the S and P fractions are shown.
(D) The percent of protein in the pellet fraction in (C) was quantified by densitometry. Error bars represent the SD from three experiments. Statistical significance was determined by two-way ANOVA with Sidak’s multiple comparison test. ***p < 0.001; **p < 0.01.
(E) Liposome sedimentation assay with Atg23 and YPL liposomes of the indicated sizes in 50 mM NaCl. Representative gels containing the S and P fractions are shown.
(F) Quantification of (E) by densitometry. Error bars represent the SD from three experiments. Statistical significance was determined by ordinary one-way ANOVA with Tukey’s multiple comparison test. ****p < 0.0001 to the no-liposome control.
(G) 6xHis-Atg23 and 6xHis-Atg23[LIL] were overexpressed in the MKO cells and analyzed by subcellular fractionation. Total (T) represents the input prior to centrifugation.
(H) Quantification of (G) from five biological replicates. Error bars represent SEM; *p = 0.016 by two-sample t test.
(I) Liposome sedimentation assays with YPL liposomes and Atg23, Atg23[LIL], M3, M4, or M5 at 100 mM NaCl. Representative gels containing the S and P fractions are shown.
(J) Quantification of (I) by densitometry. Error bars represent the SD from four experiments. Statistical significance was determined by two-way ANOVA with Tukey’s multiple comparison test. **p < 0.01; *p < 0.05.
