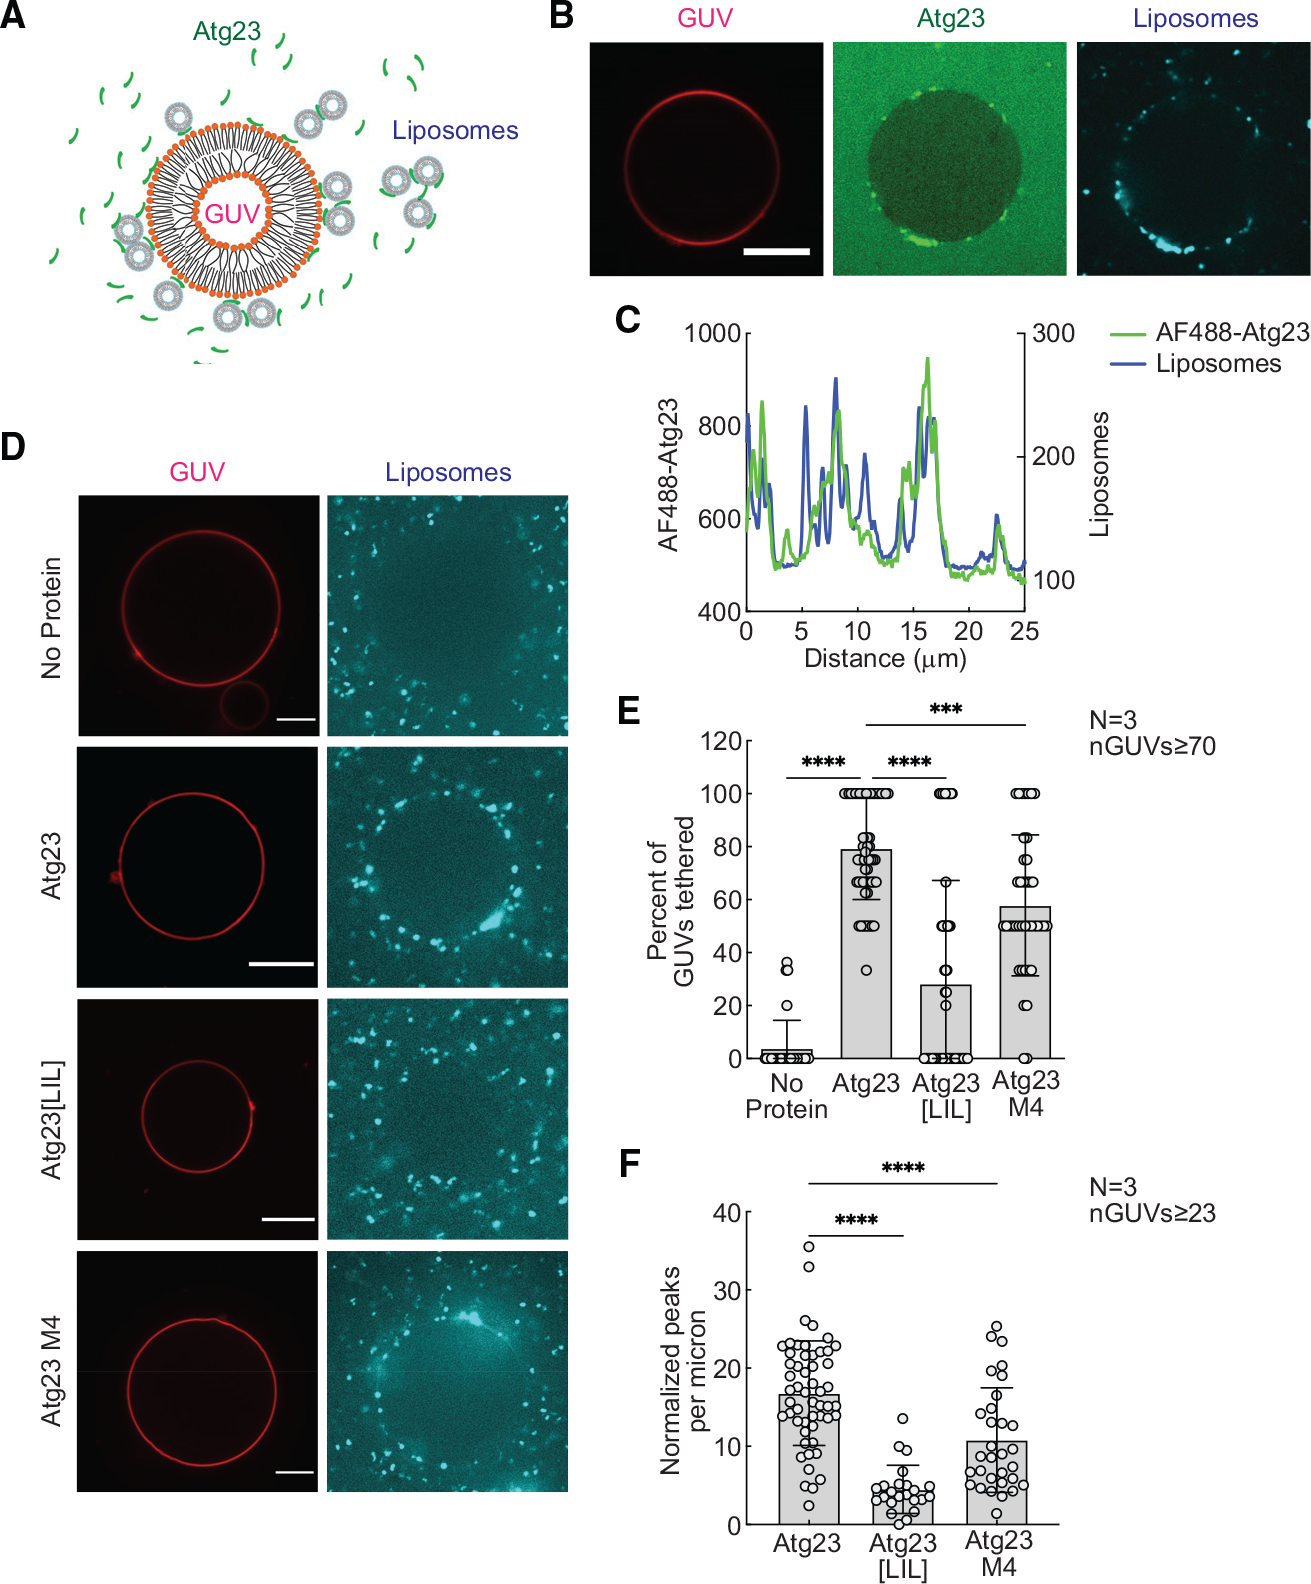
Figure 5. Atg23 is a vesicle-tethering protein.

(A) Schematic representation of the tethering assay. Colocalization of Rhod-PE-GUVs and DiD-liposomes indicates vesicle tethering.
(B) GUVs were mixed with 1 μM Alexa Fluor 488 (AF488)-Atg23 and liposomes, incubated for 10 min, and imaged in a LabTek chamber. Representative images of AF488-Atg23 (green) with tethered liposomes (cyan) are shown. Scale bar: 10 μm.
(C) Intensity profile showing AF488-Atg23 and liposome fluorescence on a segmented line placed along the surface of the GUV in (B).
(D) Representative images of liposomes (cyan) tethered on GUVs (red) in the absence of protein, with unlabeled Atg23, Atg23[LIL], or Atg23 M4. Scale bars: 10 μm. Tethering was analyzed by measuring the DiD intensity profile along the entire GUV surface. GUVs with DiD intensity profiles showing peaks that were 3-fold over the mean background intensity were categorized as GUVs with tethered liposomes.
(E) Quantification showing percent GUVs with tethered liposomes.
(F) Quantification showing normalized number of DiD intensity peaks above background on GUVs with tethered liposomes.
(E and F) Data from three independent experiments were analyzed using ordinary one-way ANOVA with Dunnett’s multiple comparisons test. ****p < 0.0001; ***p < 0.001. Error bars represent SD. n indicates number of independent repeats. nGUVs indicate total number of GUVs analyzed.
