
Fig. 3. Expression of CDCA8 is positively correlated with EZH2 in PCa.
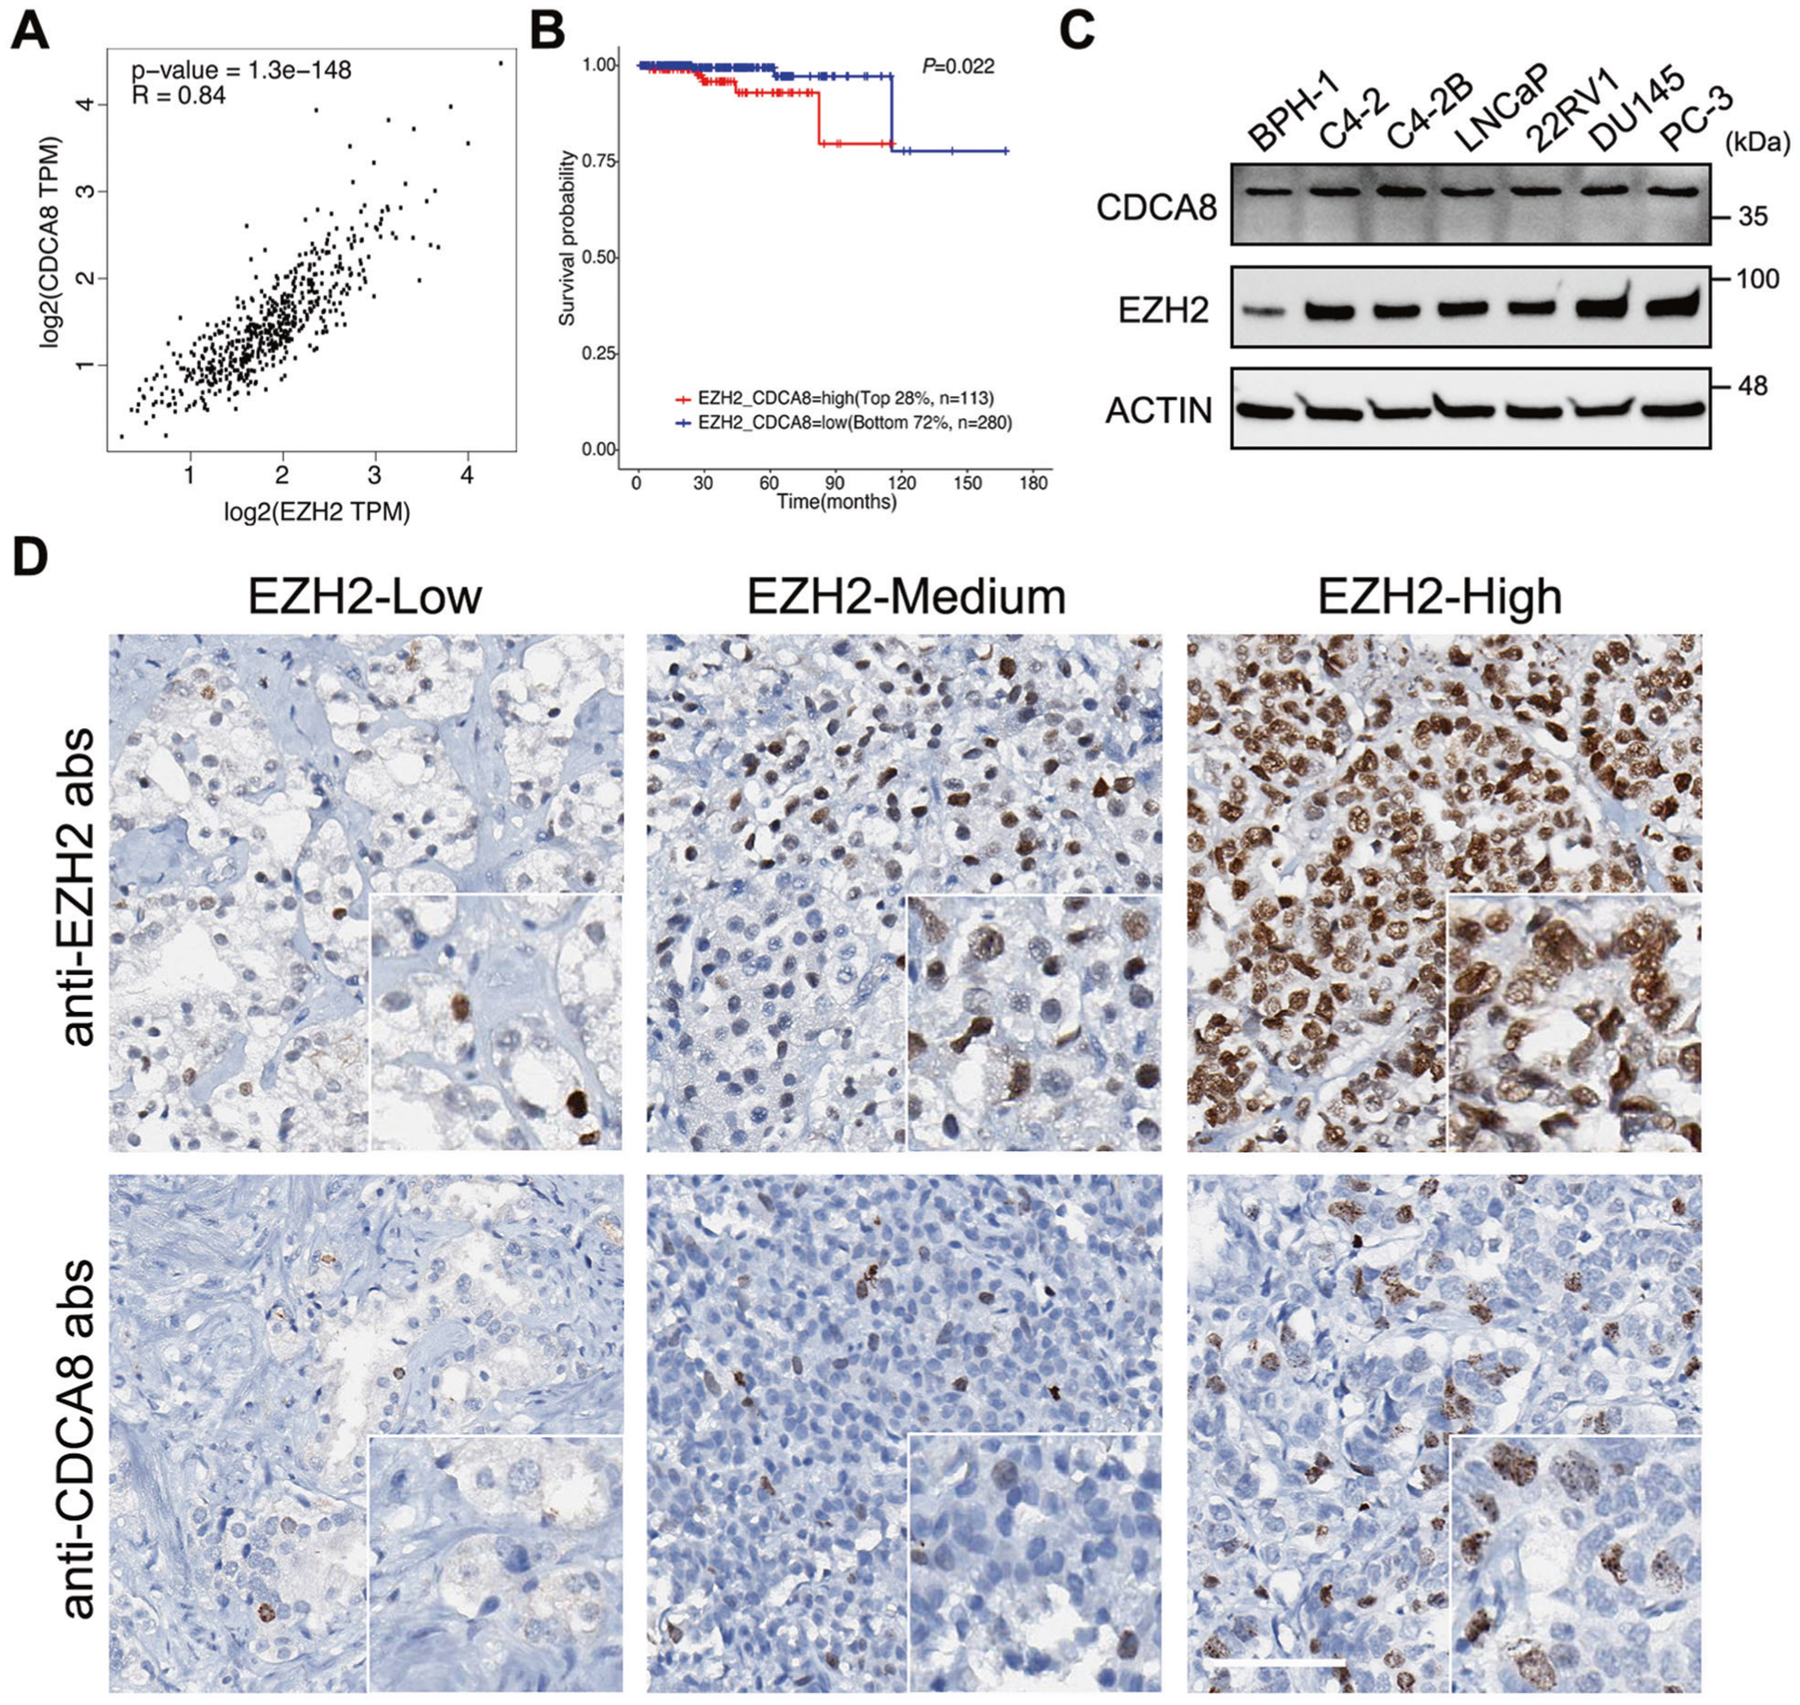
A Scatter plot showing the relationship between CDCA8 and EZH2 expressions using data from TCGA, with Spearman correlation coefficient (R) and P value as indicated. TPM transcript per million. B The association between EZH2/CDCA8 co-expression and overall survival time of PCa patients was analyzed by Kaplan–Meier analysis using data retrieved from TCGA. C Western blot analysis of CDCA8 and EZH2 expressions in six PCa cell lines and benign BPH-1 prostate cell line. D IHC staining of PCa TMA slides using the indicated antibodies. Scale bar = 80 μm.