Figure 4.
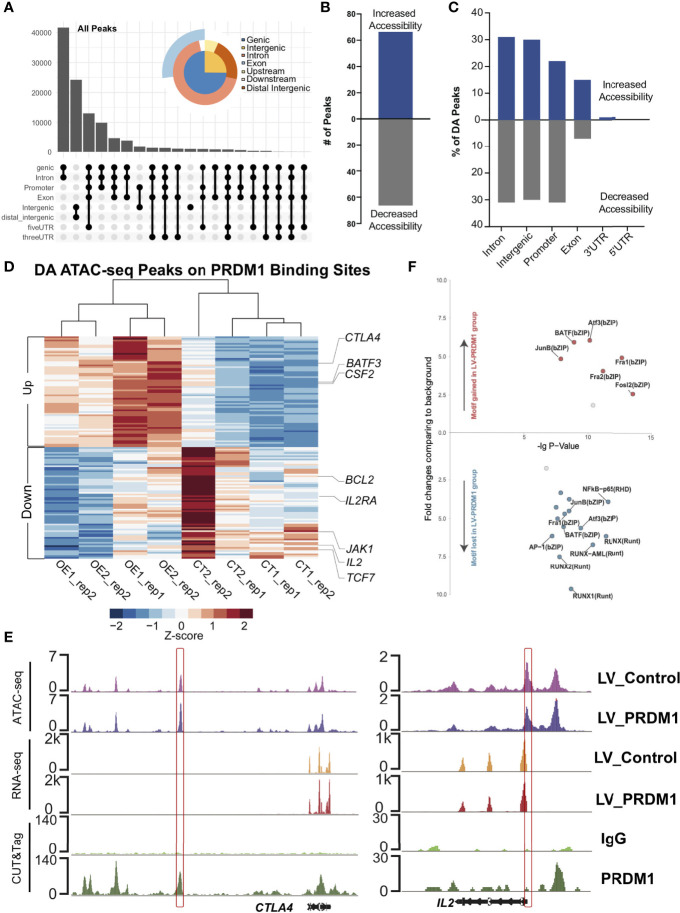
PRDM1 reshaped the epigenetic profile of T cell tolerance regulation-related target regions. (A) Categories of cis-element in all open chromatin regions (OCRs). (B) Overall OCR peak changes for PRDM1-overexpressing T cells compared to control T cells. (C) Categories of cis-element OCR peaks that changed between PRDM1-overexpressing T cells and control T cells. (D) Heatmap shown differentially accessible (DA) peaks overlapped with the PRDM1 CUT&Tag binding peaks between PRDM1-overexpressing T cells and control T cells. Selected genes assigned to the peaks are indicated. FDR q-value < 0.05. (E) WashU browser views showed PRDM1 biding sites (CUT&Tag), related gene expression level (RNA-seq) and chromatin accessibility (ATAC-seq). (F) Transcription factor motif gain or loss associated with overexpression of PRDM1. X axis represents the -logP value of the motif enrichment. Y axis represents the fold change of the motif enrichment. Targeted motifs in the changed OCR between the LV-PRDM1 and LV-Control groups were compared to the whole genome background to calculate p value and fold change.

