Figure 5.

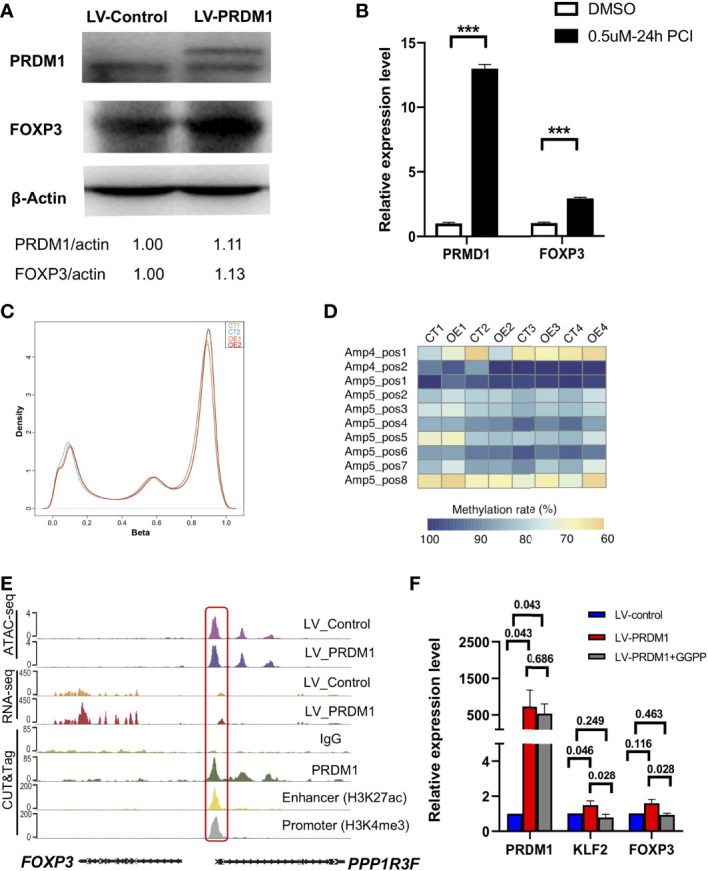
PRDM1 induced FOXP3 expression by directly binding to upstream enhancer and indirectly by upregulating KLF2. (A) Western blot showed the protein level of PRDM1 and FOXP3 in PRDM1 overexpressing Jurkat T cells compared with control T cells (two experiment repeats). (B) Quantitative real-time PCR showed the expression level of PRDM1 and FOXP3 in Jurkat cells treated with DMSO or PCI-24781. (C) Density of beta values distribution in PRDM1-overexpressing T cells and control T cells. (D) Heatmap showed the degree of methylation at each CpG motif according to the color code. (E) WashU browser views showed PRDM1 biding sites and histone modifications around FOXP3 gene locus. (F) Quantitative real-time PCR showed the expression level of PRDM1, KLF2 and FOXP3 in control T cells, PRDM1-overexpressing T cells and KLF2 inhibitor GGPP treated PRDM1-overexpressing T cells, respectively (n = 6). Friedman Test showed the P value is 0.03 for PRDM1, KLF2 and FOXP3. Then P value was analyzed by Wilcoxon rank sum test. ***P < 0.05.
