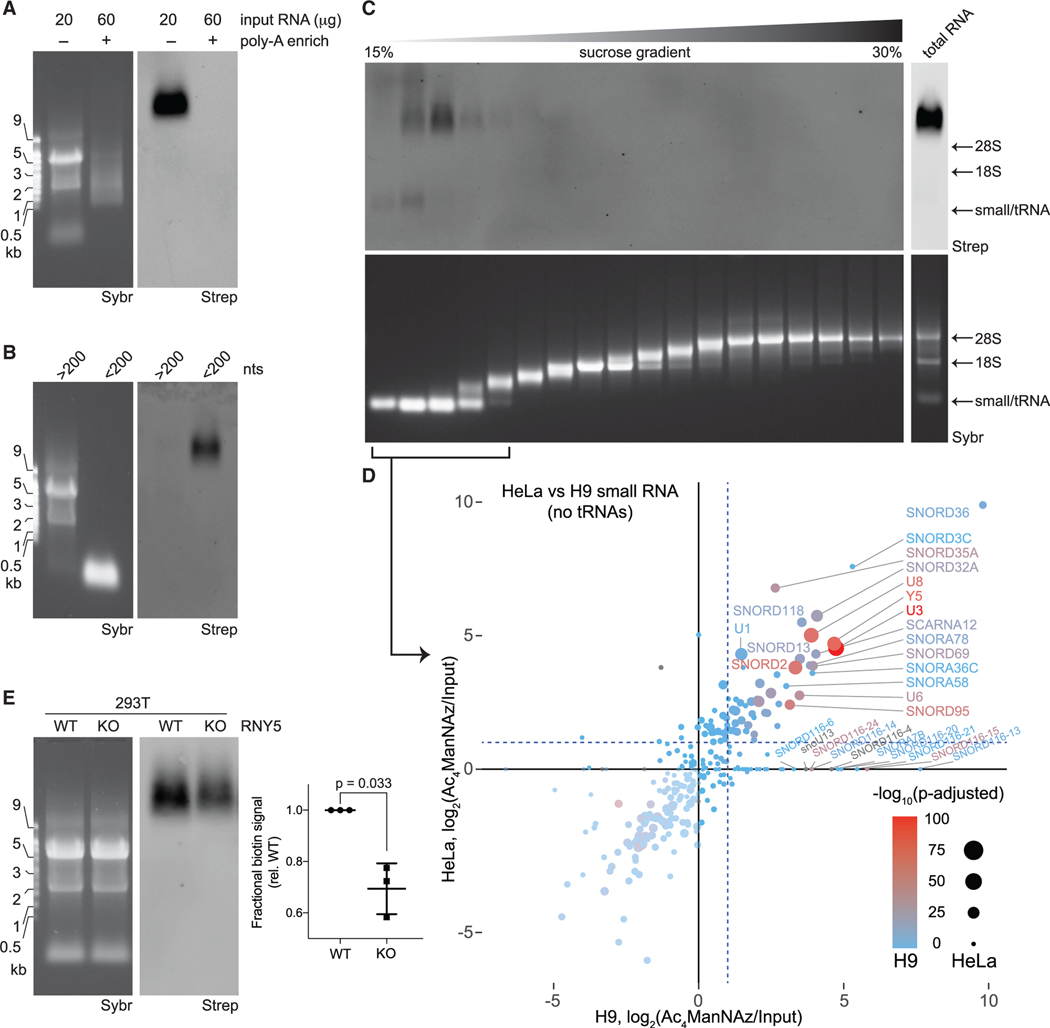
Figure 2. Small, non-polyadenylated, and conserved transcripts comprise the pool of cellular glycoRNA.
(A) Blotting of total or poly-adenylated (poly-A) enriched RNA from HeLa cells treated with Ac4ManNAz.
(B) Blotting of total RNA from HeLa cells treated with Ac4ManNAz after differential precipitation fractionation using silica-based columns.
(C) Blotting of total RNA from H9 human embryonic stem cells (H9) treated with Ac4ManNAz after sucrose density gradient (15%–30% sucrose) fractionation. An input profile is displayed to the right of the gradient.
(D) Scatterplot analysis Ac4ManNAz-enriched RNAs purified from the small RNA fractions of (C) from HeLa and H9 cells. Reads mapping to snRNA, snoRNAs, and Y RNAs are shown. Significance scores (-log10(adjusted p value) are overlaid for HeLa cells as the size of each data point and for H9 cells as the color of each data point.
(E) Representative blot of total RNA from wild-type (WT) or Y5 knockout (KO) 293T cells treated with Ac4ManNAz. Inset: quantification of the blot in (E) from biological triplicates. p value calculated by a paired, two-tailed t test.
See also Figures S2 and S3 and Tables S1 and S2.

