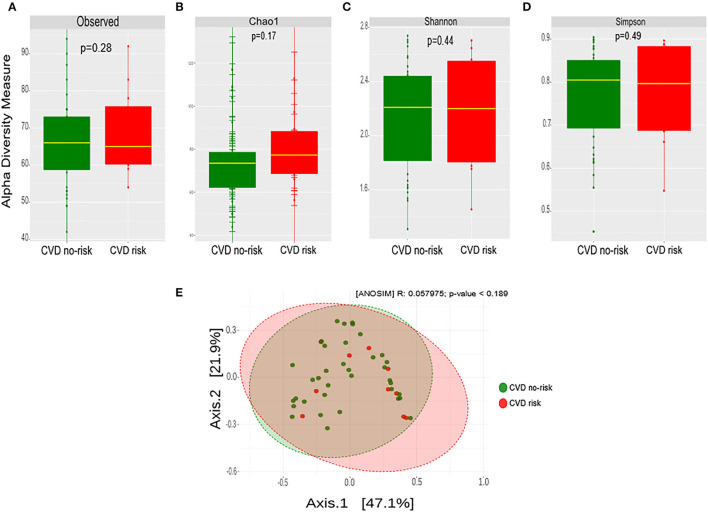
Figure 3.
Gut microbial diversity in the CVD no-risk and CVD risk groups. (A–D) Alpha diversity was measured by the four commonly used methods, Observed, Chao1, Shannon, and Simpson. The boxplots show median and interquartile (IQR) range and whiskers extending to the most extreme points within 1.5-fold IQR. (E) Beta diversity index was measured by the Bray-Curtis method using principle coordinate analysis of the relative abundance of OTUs. The two-variances explained by Axis.1 and Axis.2 are 47.1 and 21.9%, respectively. ANOSIM, analysis of similarity; CVD no-risk, N = 36; CVD risk, N = 10. P < 0.05 was considered statistically significant using Student's t-test.

