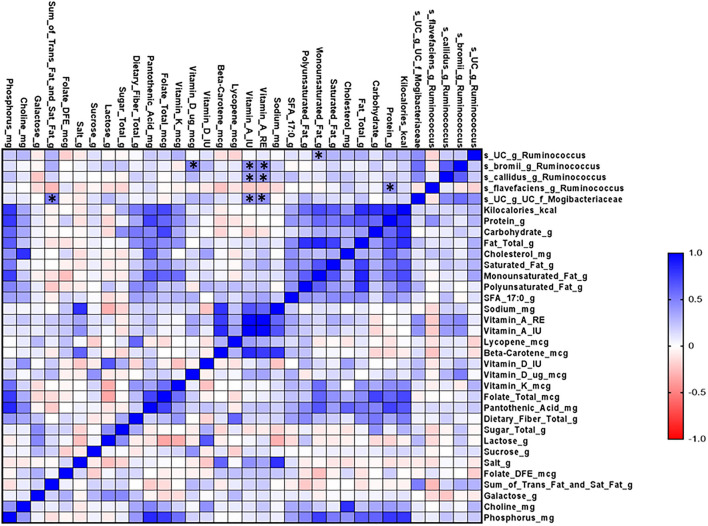
Figure 6.
Microbial correlation matrix analysis of diet and gut microbiome in the CVD no-risk and CVD risk groups. Correlation matrix analysis was performed using GraphPad Prism software. The red line indicates a negative correlation and the blue line indicates a positive correlation. CVD no-risk, N = 30; CVD risk N = 8. *p < 0.05 was considered statistically significant using Student's t-test.

